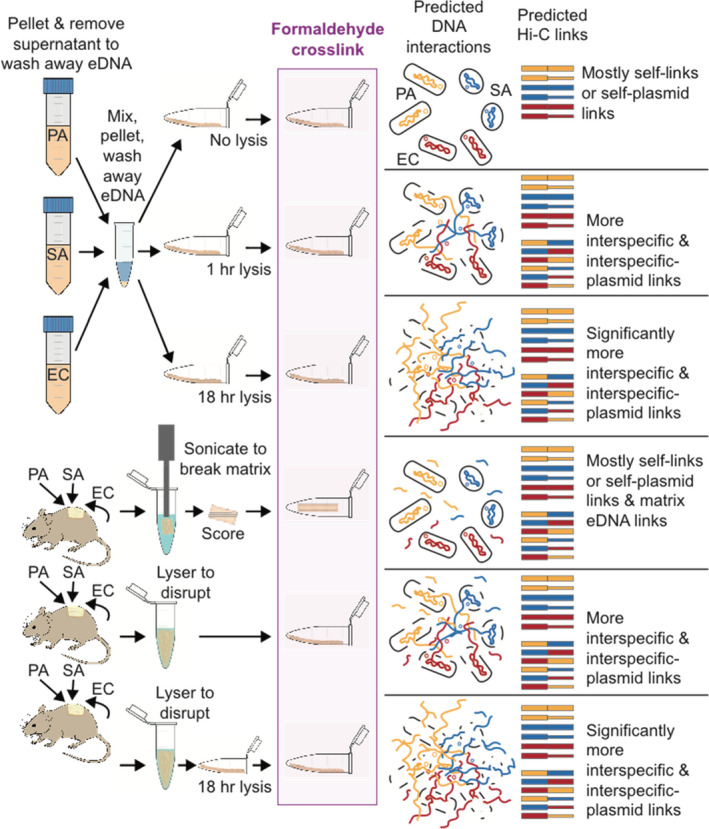
FIGURE 1.

Sample treatments and predicted DNA interactions during formaldehyde crosslinking with predicted Hi‐C link outcomes expected. EC, Escherichia coli (DNA in red); PA, Pseudomonas aeruginosa (DNA in yellow); SA, Staphylococcus aureus (DNA in blue). Plasmid DNA is shown as small circles and as thinner lines in Hi‐C links
