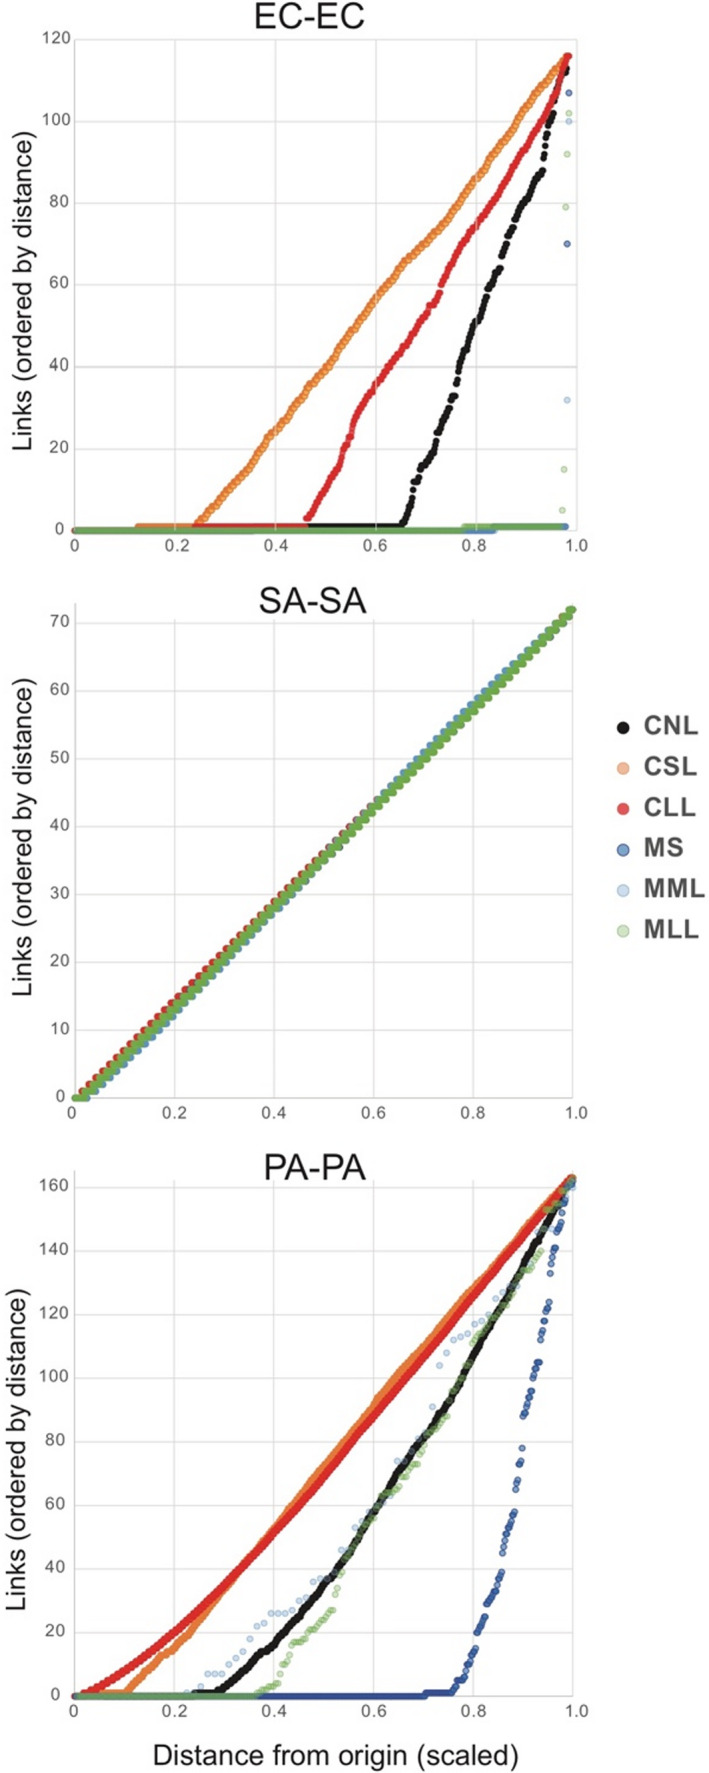
FIGURE 2.

Distance of Hi‐C links within species (i.e., self‐links) measured from origin of replication, normalized between species (i.e., link distance from origin was scaled to a value of 1). CLL, cells long lysis; CNL, cells no lysis; CSL, cells short lysis; EC, Escherichia coli; MLL, mouse long lysis; MML, mouse mechanical lysis; MS, mouse sonicated; PA, Pseudomonas aeruginosa; SA, Staphylococcus aureus. Note: in the SA–SA plot, all six treatments are depicted, but points are difficult to distinguish because they fall on the same line
