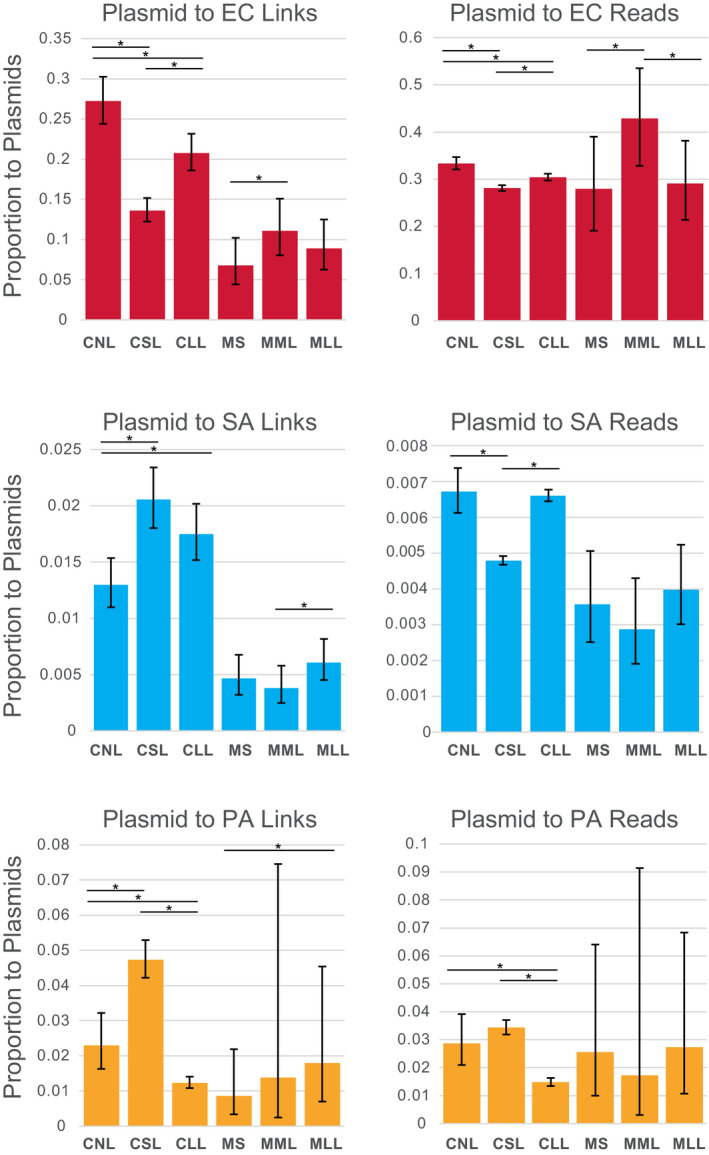
FIGURE 4.

Proportion of Hi‐C links and reads occurring between cells and plasmids (pG527 and pUPC18) plotted for cell polymicrobial “communities” and mouse wound biofilms. Asterisks show statistically significant differences (two‐proportion z‐test) and error bars show 95% confidence intervals calculated by the Wilson score method without continuity correction (Newcombe, 1998). CLL, cells long lysis; CNL, cells no lysis; CSL, cells short lysis; EC, Escherichia coli; MLL, mouse long lysis; MML, mouse mechanical lysis; MS, mouse sonicated; PA, Pseudomonas aeruginosa; SA, Staphylococcus aureus
