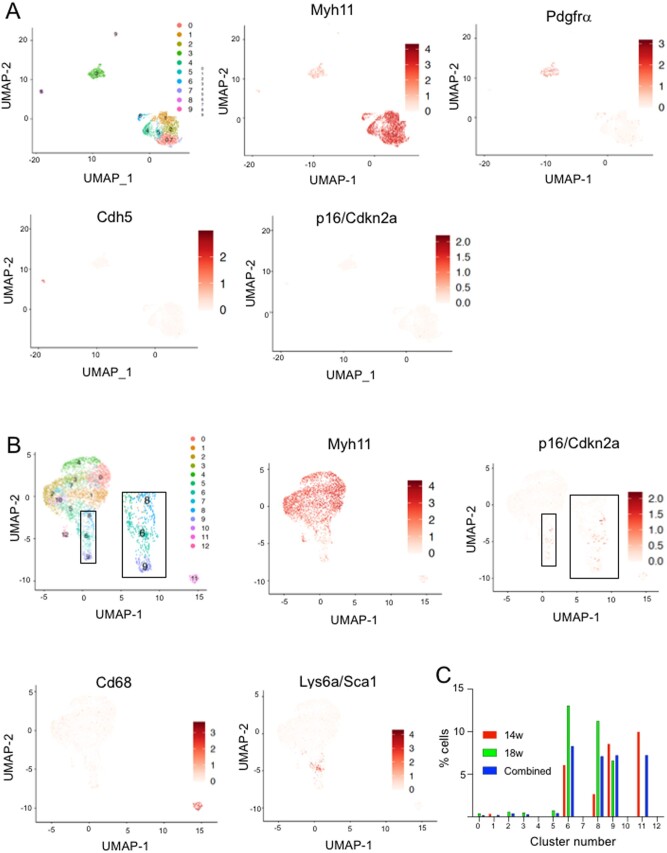
Figure 2.
p16/Cdkn2a is detected in VSMCs in mouse atherosclerotic plaques. (A and B) UMAP plots showing scRNA-seq profiles of unsorted aortic cells from Myh11CreERt2+/Confetti+ mice (A), or sorted Confetti+ VSMCs from atherosclerotic plaque and media of fat-fed Myh11CreERt2/Confetti+/ApoE−/− mice (B). Log-transformed expression levels of Myh11 and p16/Cdkn2a are shown alongside e-Cadherin/Cdh5 and Pdgfrα (A) or Cd68 and Ly6a/Sca1 (B) using a scale from white to dark red. Insets show high power regions of clusters 6, 8, and 9 and expression of p16 in (B). Feature plots show log-normalized expression levels. (C) % cells in each cluster with detectable expression of p16/cdkn2a after 14 weeks or 18 weeks or high-fat feeding, or combined.

