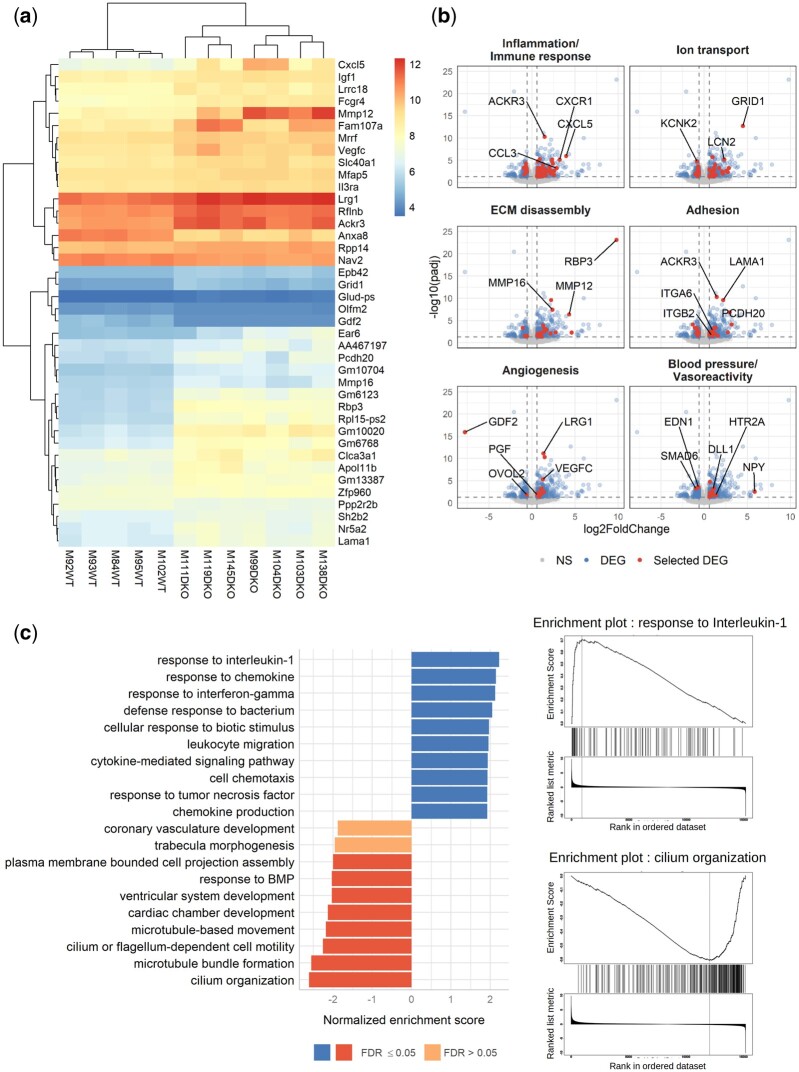
Figure 4.
RNAseq analysis of WT and DKO mouse lung tissue reveals modulation of the transcription of genes involved in inflammation, angiogenesis, blood pressure, cilium organization, and cardiac development. Five WT and seven DKO male mice were injected with tamoxifen at the age of 2 months and analysed at the age of 5 months. (A) A bi-clustering heatmap was used to visualize the expression profile of the top 40 differentially expressed genes (DEGs) between the WT and DKO conditions, with the lowest adjusted P-value by plotting their log2 transformed expression values (colour scale) for each sample. (B) Visualization of the comparison of the global transcriptional change across groups was visualized by volcano plots. Each data point in the scatter plot represents a gene. The log2 fold change of each gene is represented on the x-axis and the -log10 of its adjusted P-value on the y-axis. Genes that were not significantly differentially expressed (NS) are represented in grey, DEGs in blue, and a selection of DEG involved in specific biological processes in red (gene ontologies used for these volcano plots are listed in the Supplementary material online, Table S3). (C) Gene-set enrichment analysis (GSEA) performed using the functional database gene ontology/biological process non-redundant. The top 10 positive (blue) and negative (red) categories are presented. Each bar represents a gene ontology, the normalized enrichment score is represented on the x-axis, and the colour of the bar represents the FDR P-value. Enrichment plots for the top positive and negative terms are shown on the right..

