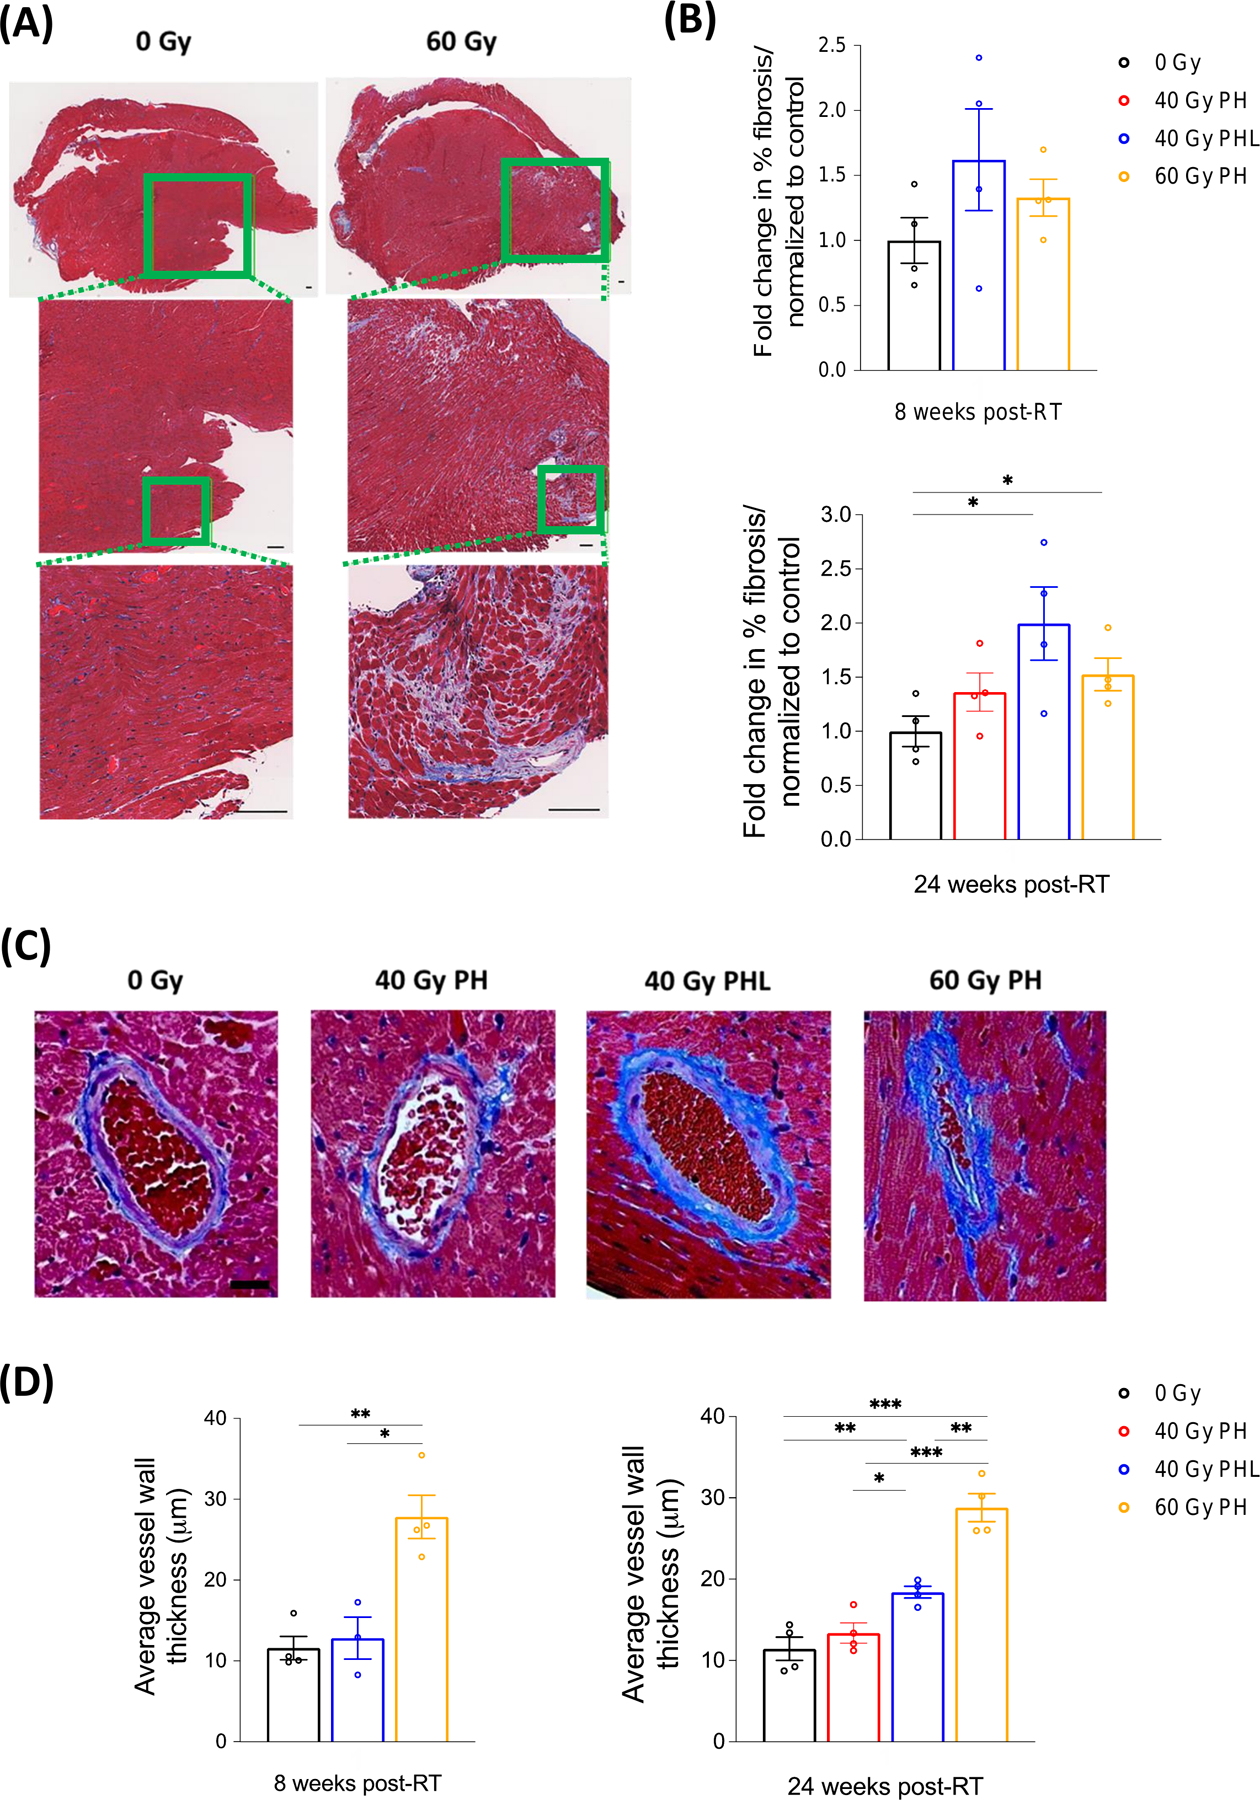
Figure 3. Masson’s trichrome staining of cardiac tissue at 8 and 24 weeks post-RT.

A, Representative trichrome stains from 0 and 60 Gy cohorts at 8 weeks post-RT. Cardiac tissue is characterized by perivascular fibrosis superimposed on scattered interstitial fibrosis. Scale bar 100 µm. B, Quantification of fibrosis per measured area (n=4 per group). P=0.022 and 0.017 for 40 Gy PHL and 60 Gy PH cohorts, respectively. C, Representative vessels from each RT cohort showing perivascular fibrosis, vessel wall thickening, and lumen narrowing in irradiated cohorts 24 weeks post-RT. D, Quantification of vessel wall thickness in the lower half of the heart (irradiated region) (n=4 per group). At 8 weeks *P=0.022 and **P=0.002. At 24 weeks *P=0.013, **P=0.001 (60 Gy PH) and 0.005 (control), and ***P<0.001 (control and 40 Gy PH). Scale bar 20 µm.
