
Figure 4. Quantitative echocardiography.
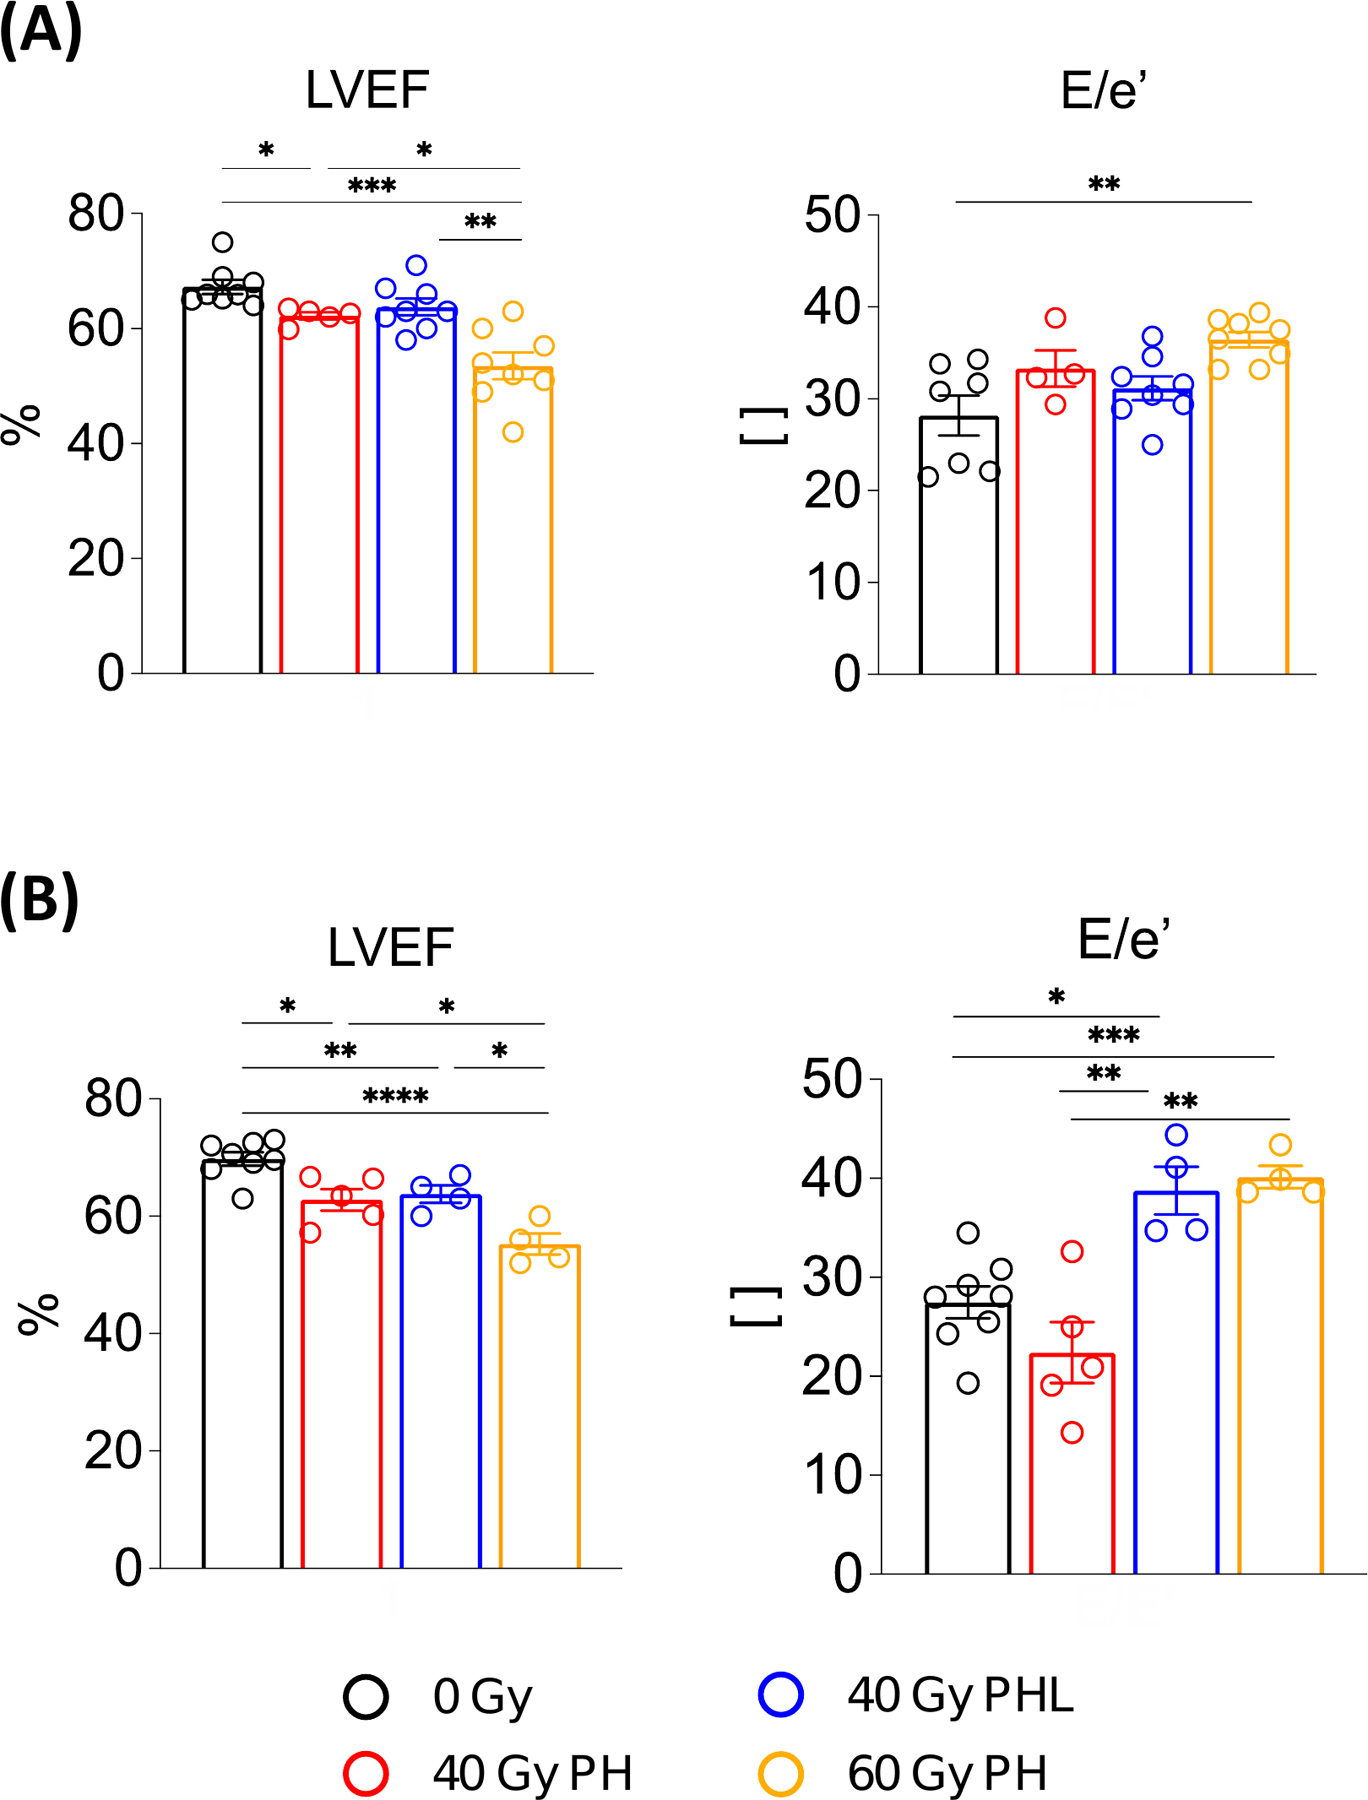
A, Comparison of cardiac systolic and diastolic functional parameters between irradiated and non-irradiated groups 8 weeks post-RT (n = 8, 5, 8, 8 per group). B, Corresponding comparison at 16 weeks post-RT (n = 8, 5, 4, 4 per group). *P<0.05, **P<0.01, ***P<0.001, ****P<0.0001 (details in supplementary Table S1). E/e′, ratio of mitral peak velocity of early filling (E) to early diastolic mitral annular velocity (e′).