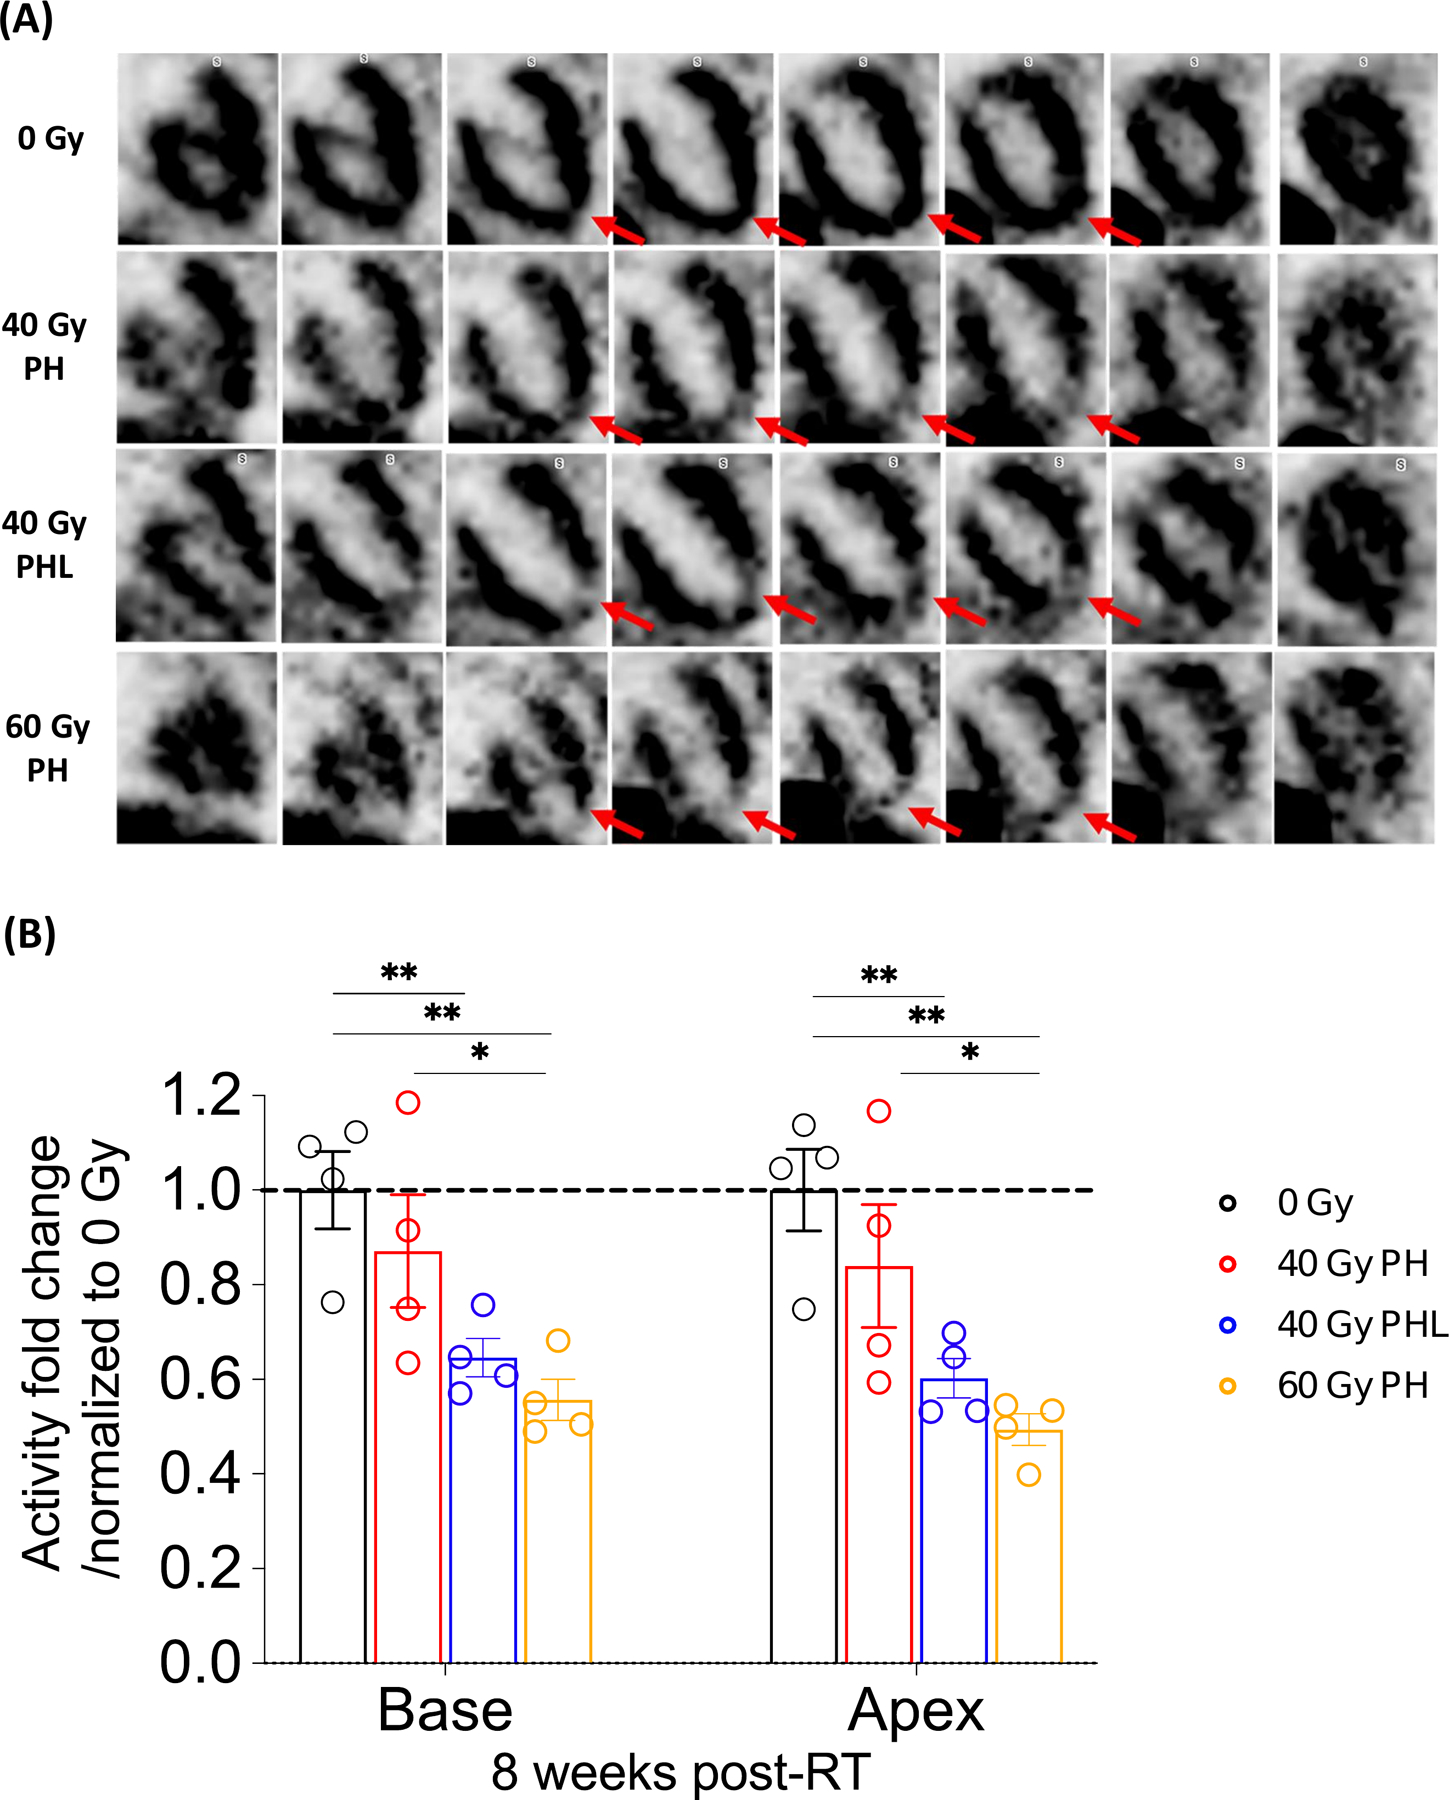
Figure 5. Tc-99 sestamibi SPECT.

A, From top to bottom row, representative frontal view of control mouse, 40 Gy PH, 40 Gy PHL, and 60 Gy PH RT mice 8 weeks post-RT. Red arrows highlight differences in apical left ventricular (LV) perfusion. B, Basal and apical LV tracer uptake at 8 weeks post-RT (n= 4 per group). *P<0.05, **P<0.01, (details in Supplementary Table S2).
