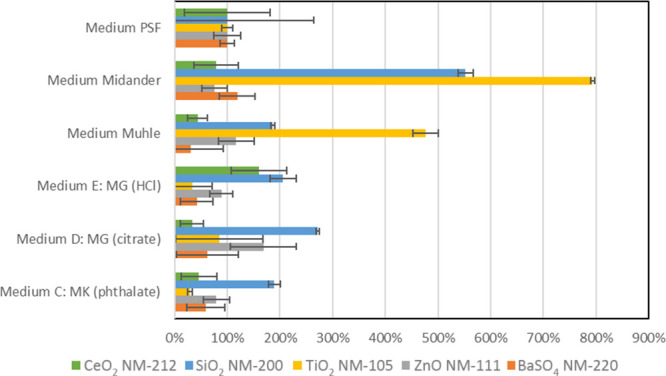
Figure 2.

Dissolution rates normalized to the rate in the PSF benchmark medium to clearly visualize the deviation between media. The color code represents the five ENM test materials.

Dissolution rates normalized to the rate in the PSF benchmark medium to clearly visualize the deviation between media. The color code represents the five ENM test materials.