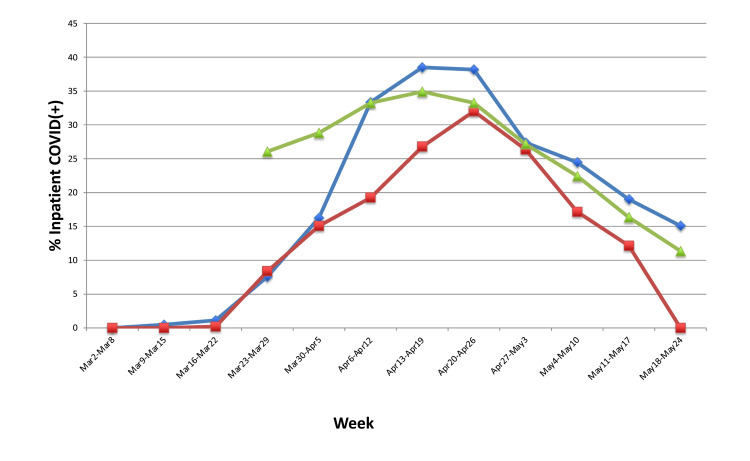
Figure 3.
The percentage of inpatient hospital beds occupied by COVID-19 positive patients in each of the hospitals over the study period.
Notes: Blue diamond, hospital 1; Red square, hospital 3; Green triangle, hospital 3. Data from hospitals 1 and 3 represent weekly averages based on daily reported values, whereas hospital 2 is based on weekly reported values.

