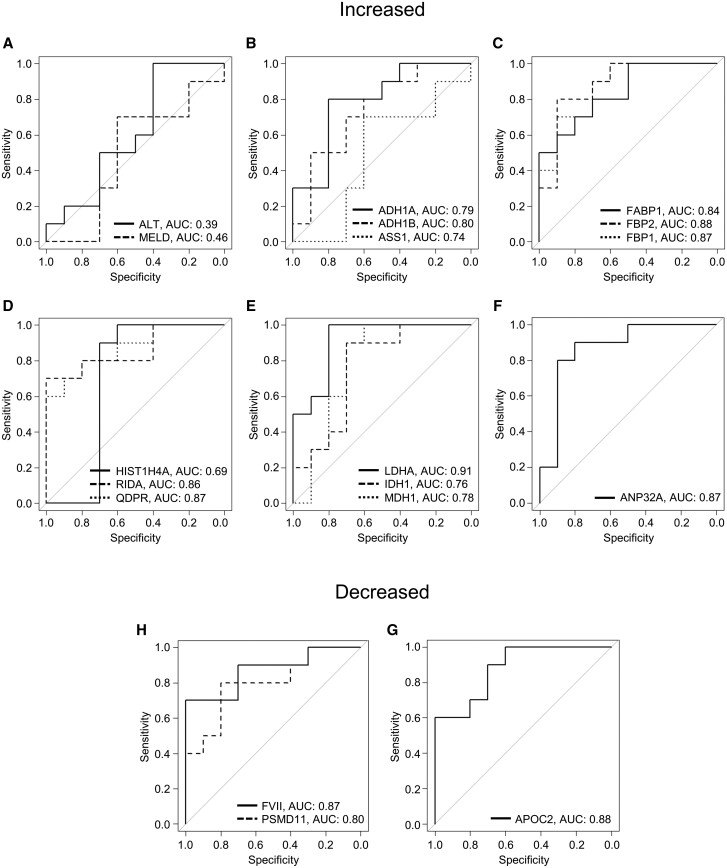
Figure 2.
Receiver operating characteristic (ROC) curves for the 16 biomarker candidates. Day 1 serum samples from survivors (n = 10) and nonsurvivors (n = 10) of acetaminophen-induced acute liver failure and healthy controls (n = 10) were subjected to untargeted proteomics. A–F, ROC curves for the elevated biomarkers. G–H, ROC curves for the decreased biomarkers.

