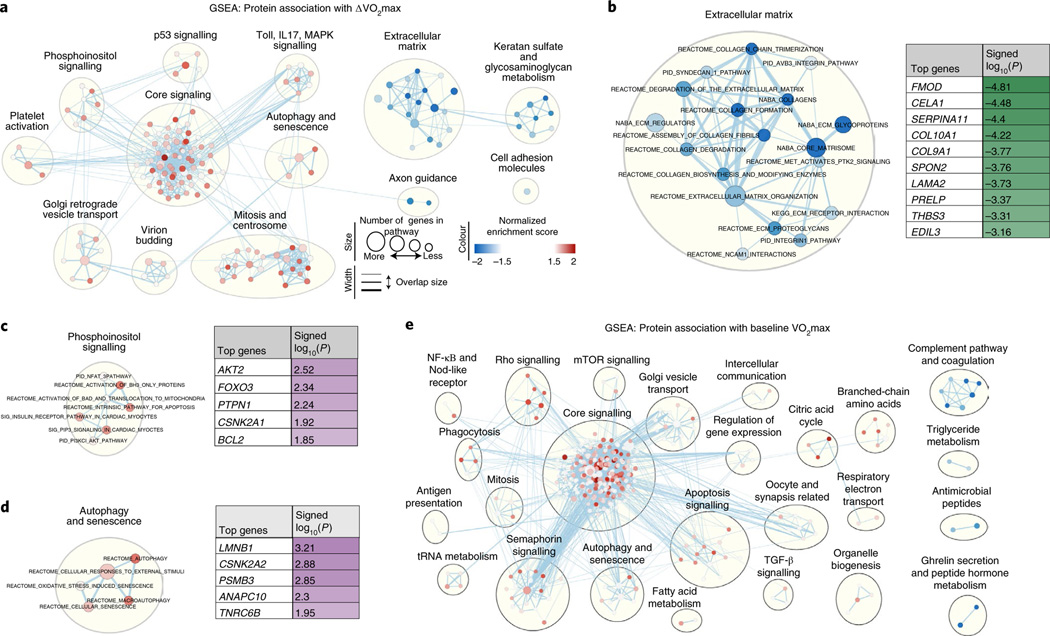
Fig. 4 |. GSEA for proteins associated with ΔVo2max or baseline Vo2max.
Overview of overrepresented biological pathways and their connectivity using Cytoscape v3.7.1. a, Network visualization of GSEA results using the complete dataset of protein–ΔVO2max associations. Red dots indicate pathways with over-represented positive protein–ΔVO2max associations, and blue dots indicate over-represented negative protein–ΔVO2max associations. A larger circle size denotes a larger number of genes in a pathway, and darker shades indicate a higher degree of enrichment. Clusters indicate biological pathways with shared proteins and biological function. b–d, Selected clusters of biological pathways with annotation, from a; the top contributing proteins to enrichment score are shown in a table. e, Network visualization of GSEA results using the complete dataset of protein–baseline VO2max associations.

