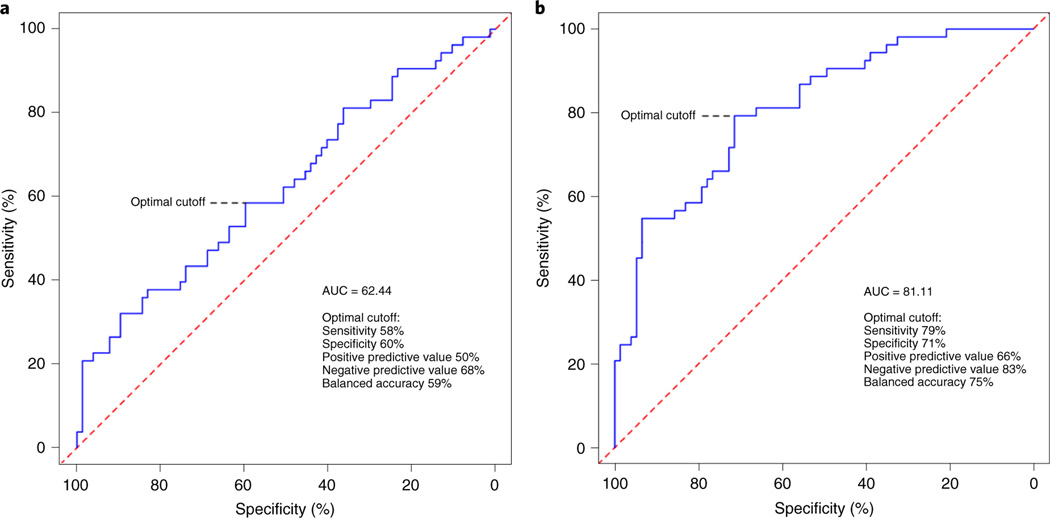
Fig. 5 |. ROC curves for relative Vo2max changes with exercise training > 15%.
a, The clinical trait score (age, sex, BMI and race) had a modest AUC. b, Addition of the protein score significantly improved the AUC. The sensitivity, specificity, positive predictive value, negative predictive value and accuracy at the optimal cutoff are included.

