
Figure 4.
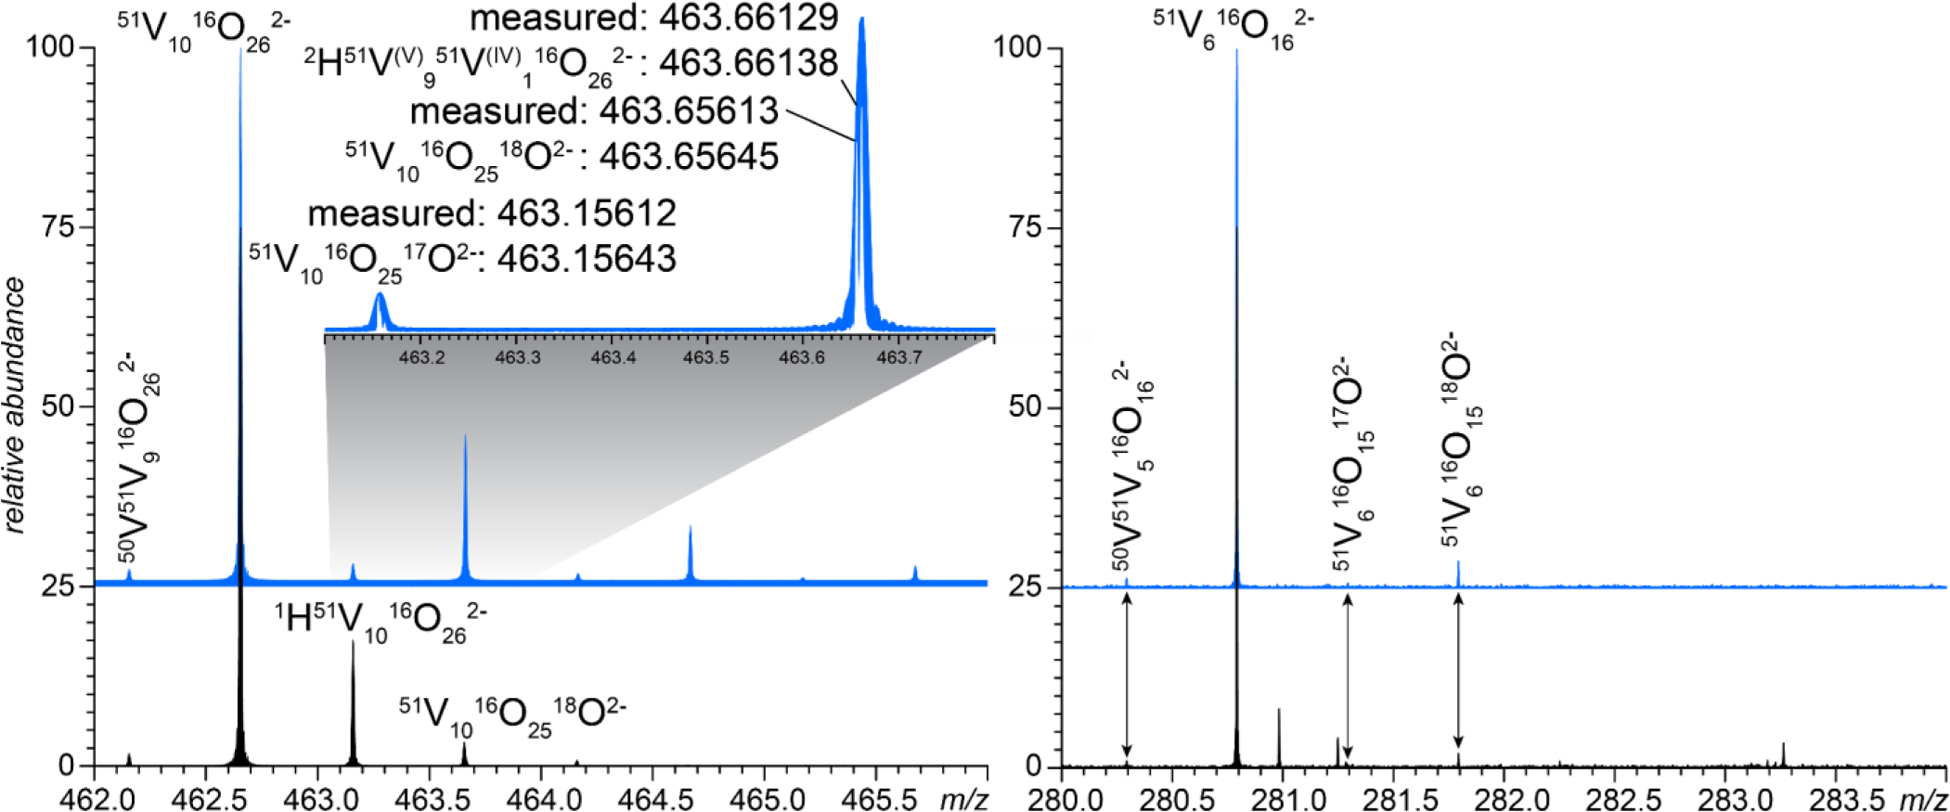
Zoomed views of mass spectra of V10 (sodium salt) acquired in H2O and 2H2O (black and blue traces, respectively) showing isotopic clusters corresponding to V10O262ˉ (left) and V6O162ˉ (right). The inset on the left panel shows the results of high-resolution measurements acquired in the narrow-band mode.