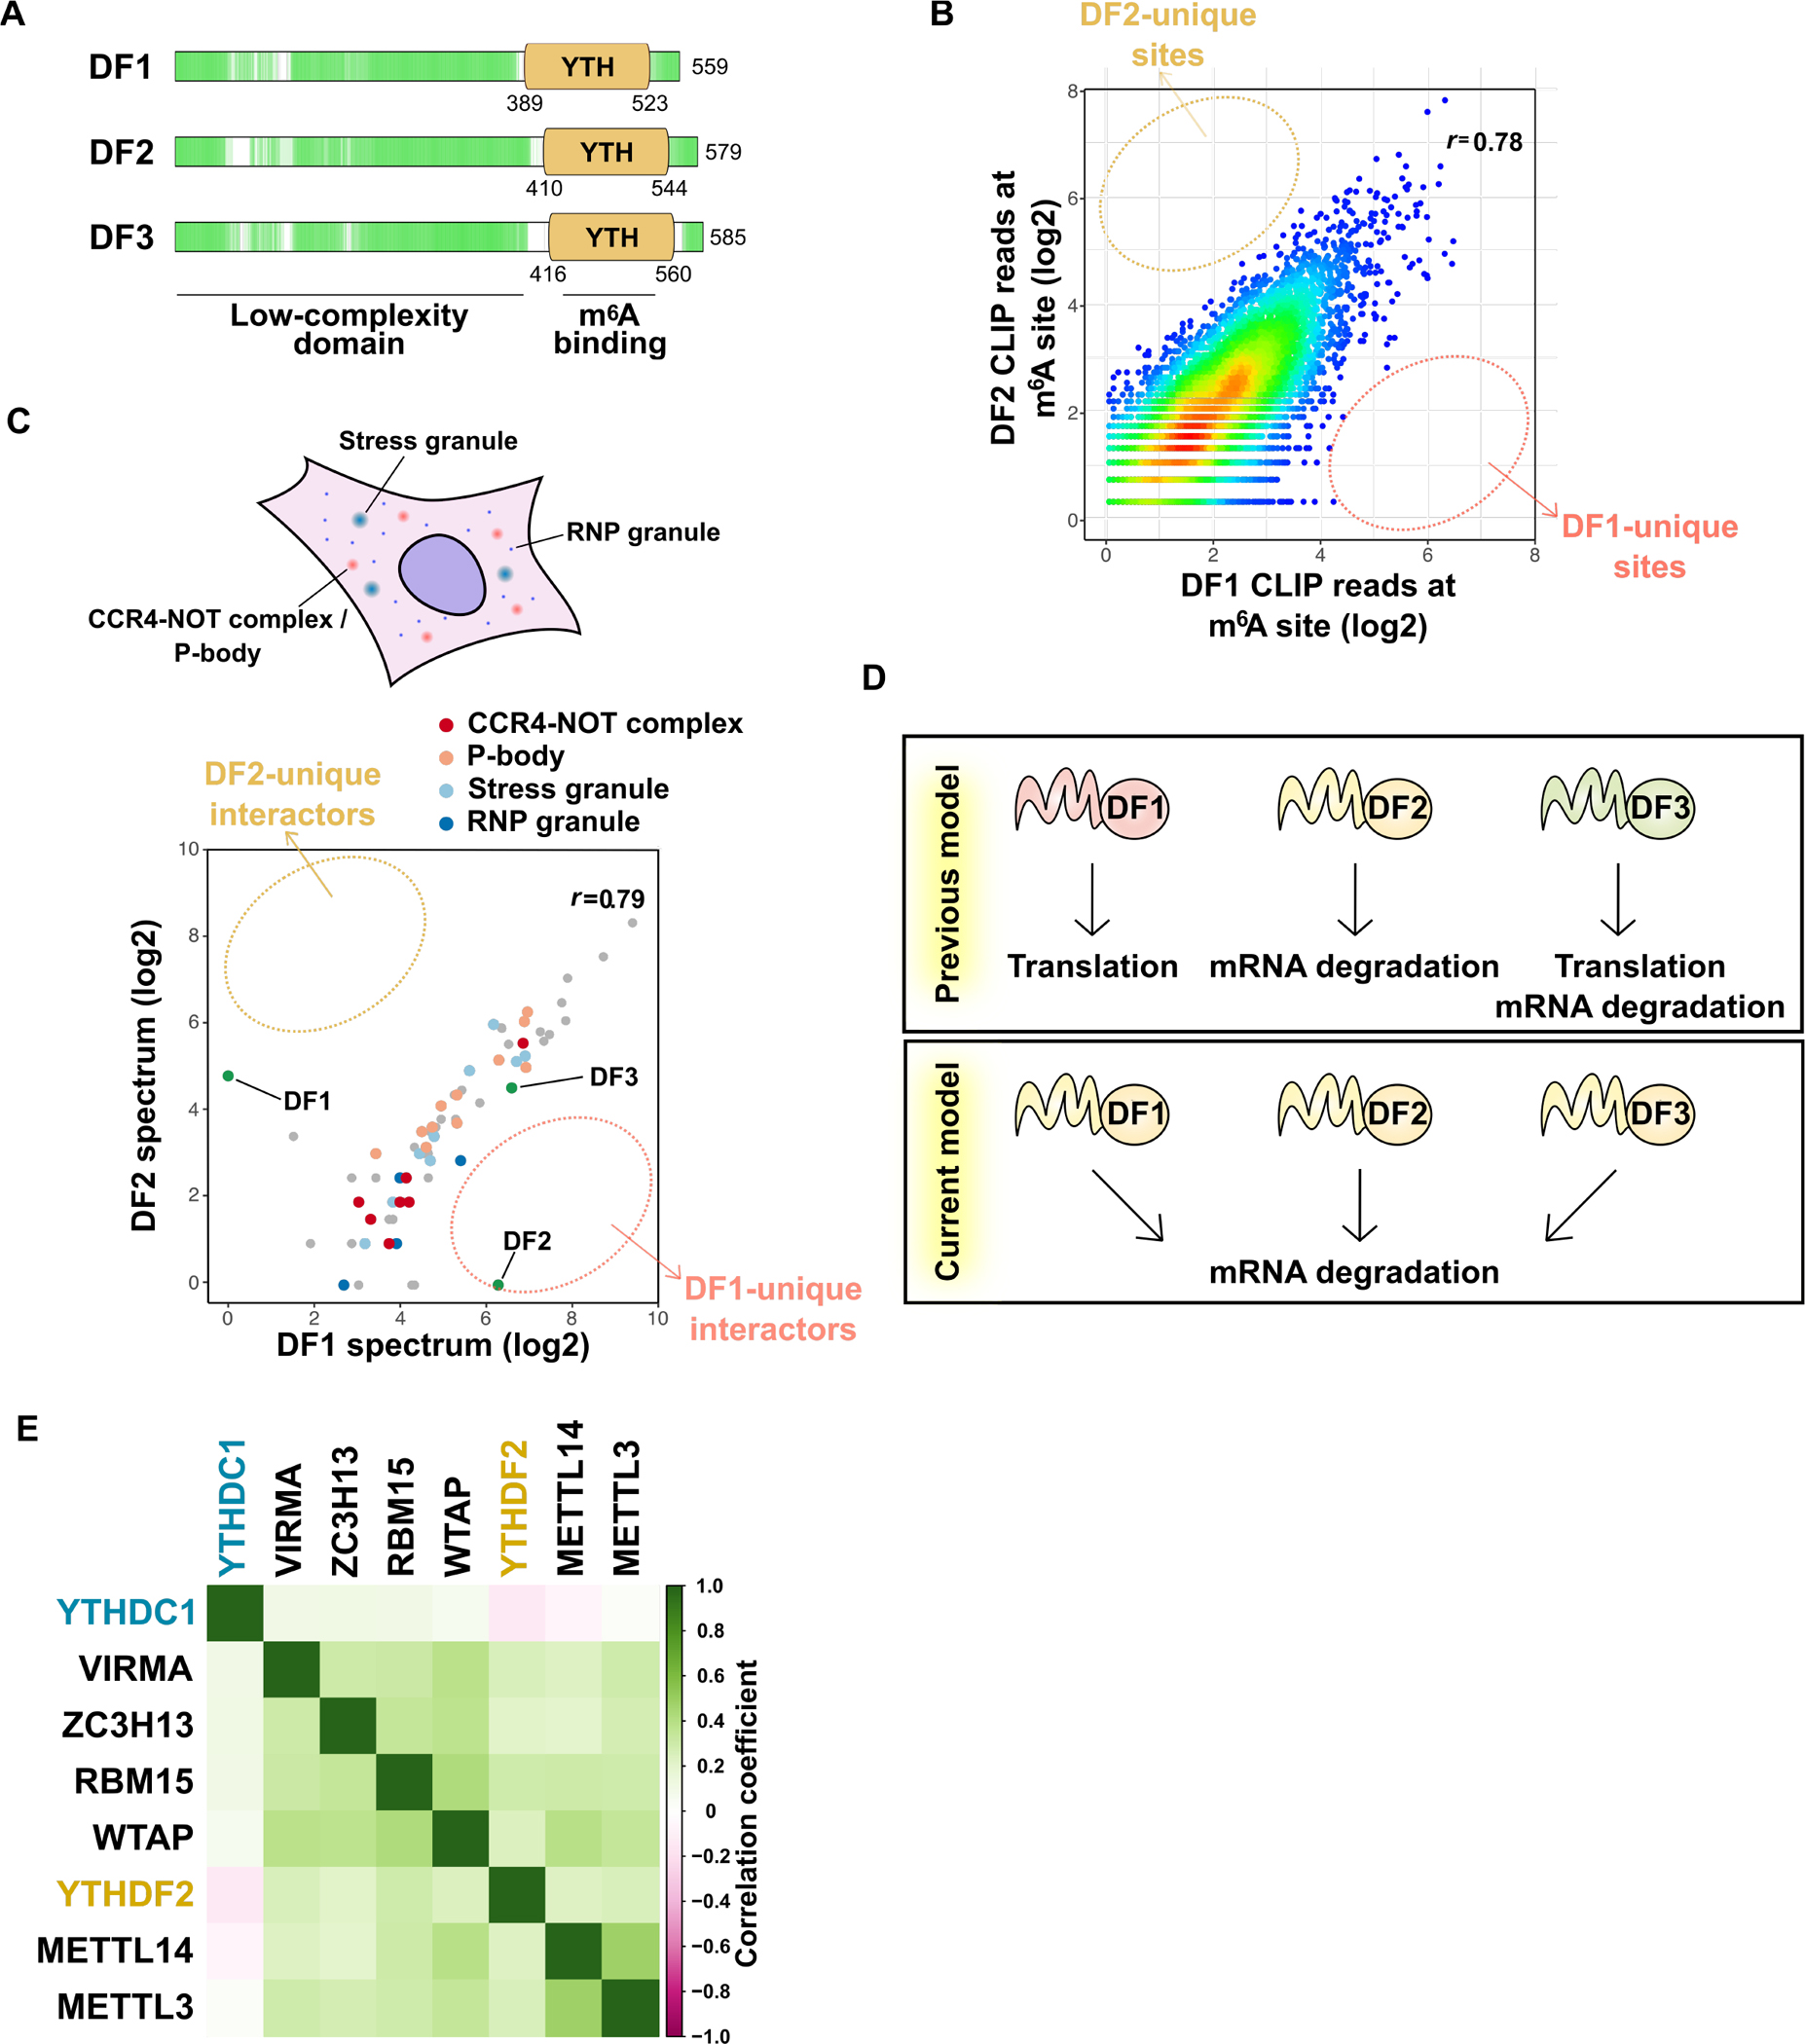
Figure 3. YTHDF proteins function together to promote degradation of m6A-marked mRNAs.

(A) DF proteins are low-complexity domain-containing “m6A reader” proteins. All three paralogs are highly similar and contain a proline-, glutamine-, and asparagine-rich low-complexity domain (green) followed by m6A-binding YTH domain. The low-complexity domain allows these three DF proteins to localize to granule structures such as RNP granules, P-body, and stress granules.
(B) All DF paralogs bind to all m6A sites, with no DF paralog showing preferential binding to any m6A site. Shown is a pairwise comparison of DF1 and DF2 iCLIP coverage at each single nucleotide-resolved m6A site in HEK293T cells. The color indicates the density. r, Pearson correlation coefficient. Similar results are seen when comparing DF3 to either DF1 or DF2 (Zaccara and Jaffrey, 2020).
(C) All three DF paralogs likely serve the same function since they interact with same sets of proteins. Pairwise comparison of the probabilities of interaction for DF1- and DF2-interacting proteins determined by proximal labeling and proteomics (Youn et al., 2018). Proximal proteins were detected by DF1 or DF2 C-terminally tagged with promiscuous biotin ligase (BirA). The average probability of interaction for either DF1 or DF2 or both higher than 0.9 are shown. r, Pearson correlation coefficient.
(D) Revised model of the YTHDF protein function. DF1 and DF3 were previously shown to promote translation, while DF2 and DF3 enhance mRNA degradation. More recent studies show all three DF proteins redundantly promote mRNA degradation.
(E) DF2 is the major protein mediating the effects of m6A on cell survival and proliferation. DepMap analysis reveals genes that show similar patterns of gene dependency as METTL3 across over 1000 different cell types. Members of the writer complex show the highest similarity to METTL3 in the different cell lines. The DF2 also shows a similar type of gene dependency as METTL3. In contrast, the pattern of cell dependency on DC1 shows poor correlation with METTL3. Dependency scores for m6A writers and readers for each cell line were analyzed by pairwise comparison. Pearson correlation coefficients were visualized in the matrix heatmap upon hierarchical clustering.
