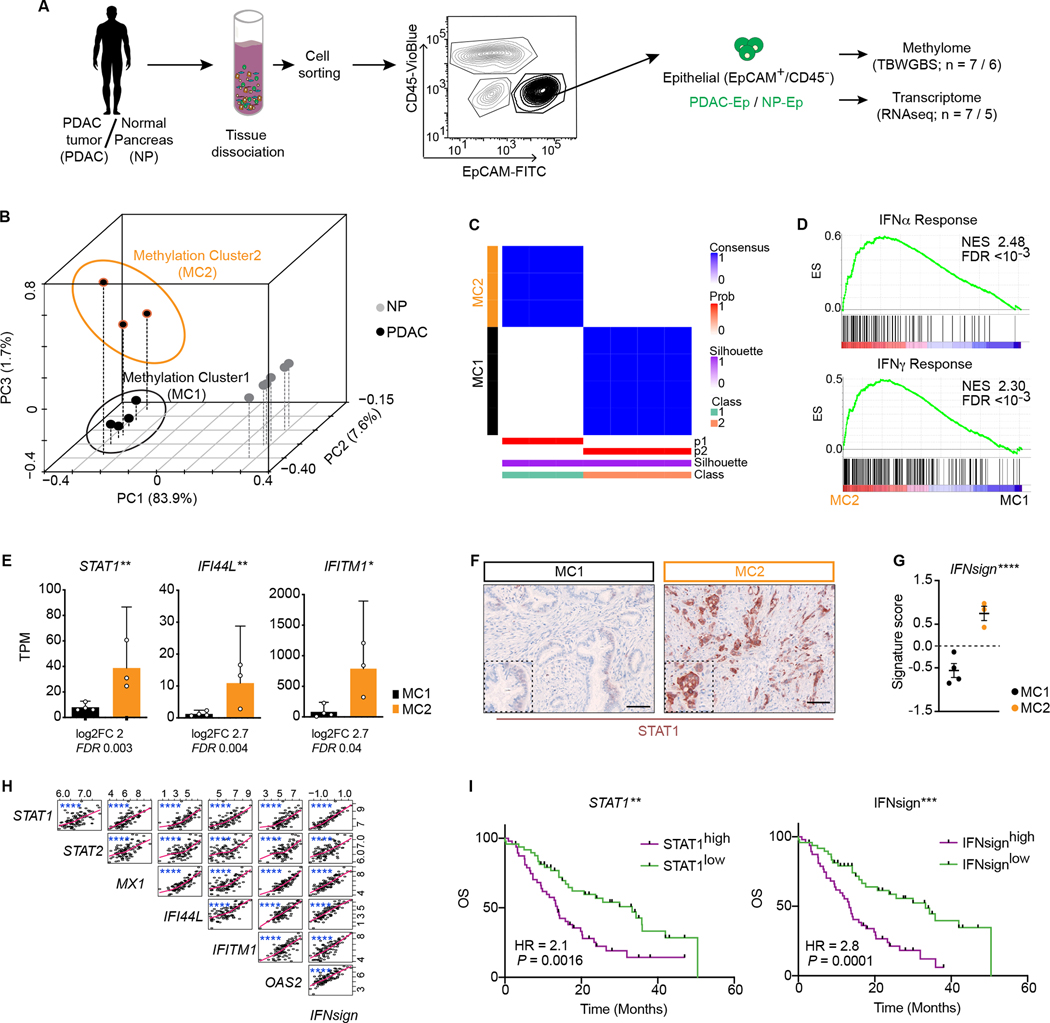
Figure 1. Methylation patterns of epithelial cells identify two groups of tumors associated to IFN signaling and survival.
A, Scheme depicting strategy for tissue processing and isolation of epithelial cells. B, Principal component analysis using PDAC-Ep vs NP-Ep DMRs. Percentage indicates proportion of variance explained by each component. C, Consensus clustering of PDAC-Ep samples. D, Gene set enrichment analyses (GSEA) of IFN response signatures in MC2 vs MC1. ES, enrichment score; NES, normalized enrichment score; FDR, false discovery rate. E, mRNA levels (transcript per million, TPM) of indicated genes. Data are mean + 95% CI; two-tailed Wald-test. F, Representative staining of STAT1 in one MC1 and one MC2 sample. G, Interferon signature score. Lines are mean ± 95% s.e.m.; paired (of mean expression of each gene in the signature) two-tailed t-test. H, Cross-correlations between indicated genes in patient cohort. Each dot is one patient. r, Spearmańs rank correlation coefficient. I, Kaplan-Meier curves display overall survival (OS) of patients with low or high expression of STAT1 or IFNsign according to median. HR, Hazard ratio; logrank-test. H-I: Data source: (25). * FDR/P < 0.05; ** FDR/P < 0.01; *** P < 0.001; **** P < 0.0001.

