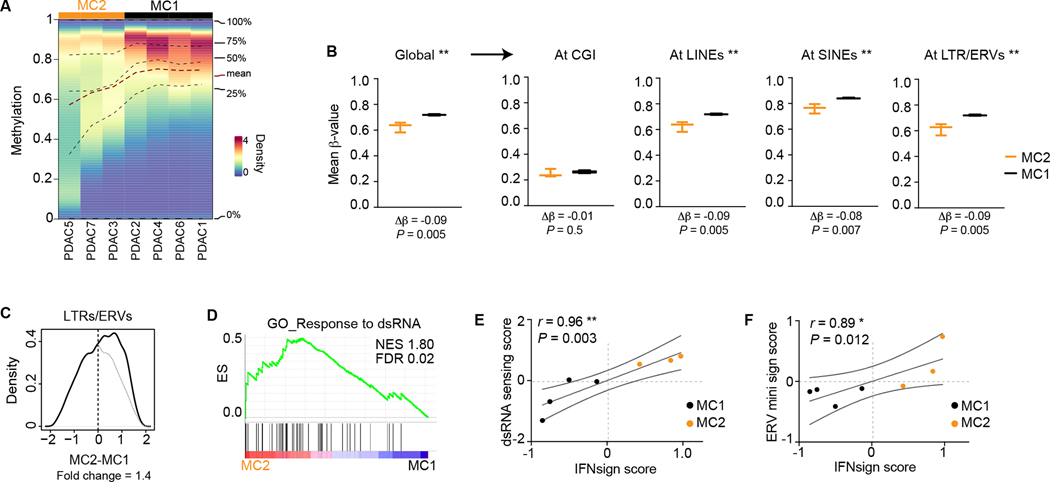
Figure 2. Hypomethylation at non-CGI sites and dsRNA sensing accompanies IFNsignhigh tumors.
A, Methylation density plot. Lines indicate quartiles and mean values. B, Global methylation and mean methylation of CGs at different genomic features calculated per sample and plotted per group. n = 3 (MC2), 4 (MC1). Boxes extend from 25th to 75th percentiles with line representing median. Whiskers indicate minimum and maximum values. Two-tailed t-test. C, Distribution of expression difference of indicated repetitive elements between MC2 and MC1 (see methods for details). Fold change of area under the curve is shown. Gray line mirror projection of the line at negative values. D, Gene set enrichment analyses in MC2 vs MC1 samples. ES, enrichment score; NES, normalized enrichment score; FDR, false discovery rate. E-F, Correlations between IFN signature score and dsRNA sensing score (E) or ERV expression score (F). r, Spearmańs rank correlation coefficient; ** P < 0.01, * P < 0.05.

