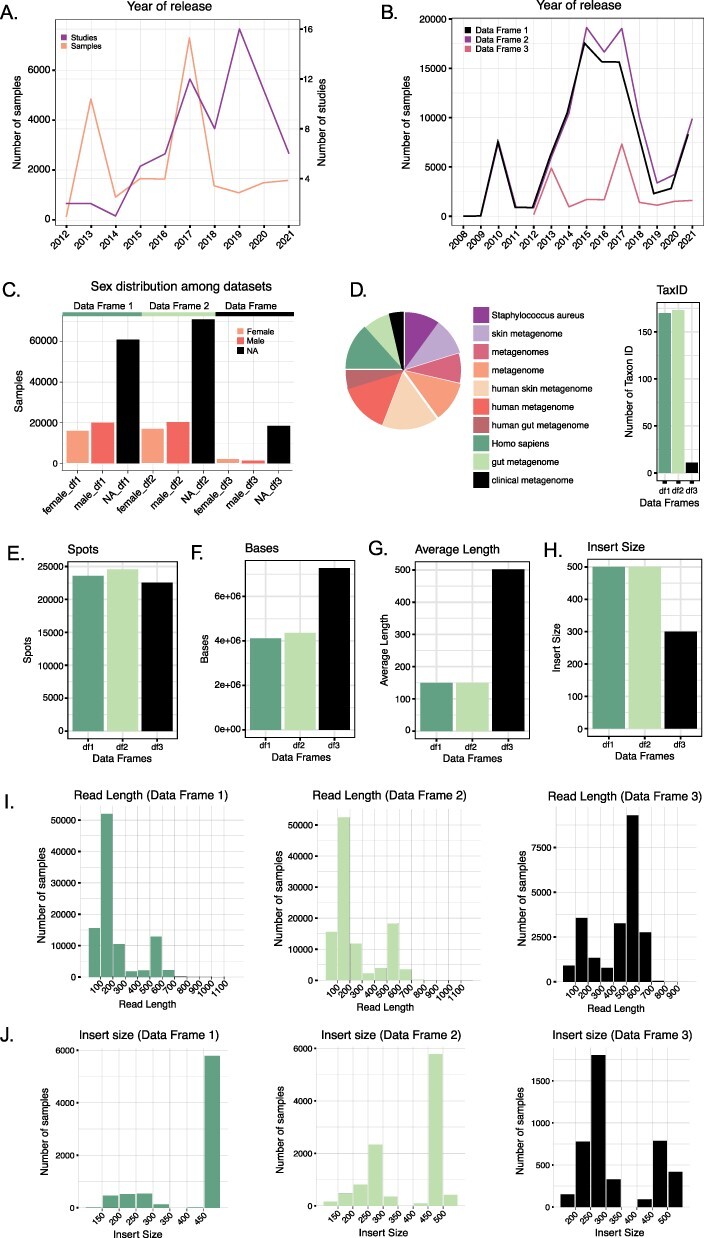
Figure 2.

(A) Number of studies and samples from Data Frame 3 released every year starting from 2012. (B) Comparison of the number of samples released each year for the three Data Frames. Data Frames 1 and 2 contain samples starting from 2008, whereas Data Frame 3 only from 2012. (C) Distribution of the variable ‘sex’ in the three Data Frames. In all three cases, the majority of the samples do not have such information reported. (D) The number of Taxon ID/Scientific names used in the three Data Frames (barplot) and relative abundance (as a logarithm) of the Taxon ID/Scientific names used for the samples in Data Frame 3 (pie chart). (E–H) Comparison of the median number of spots (E), bases (F), reads average length (G) and insert size (H) in the three Data Frames. (I) Read length distribution in the three Data Frames. (J) Distribution of the insert size in the three Data Frames.
