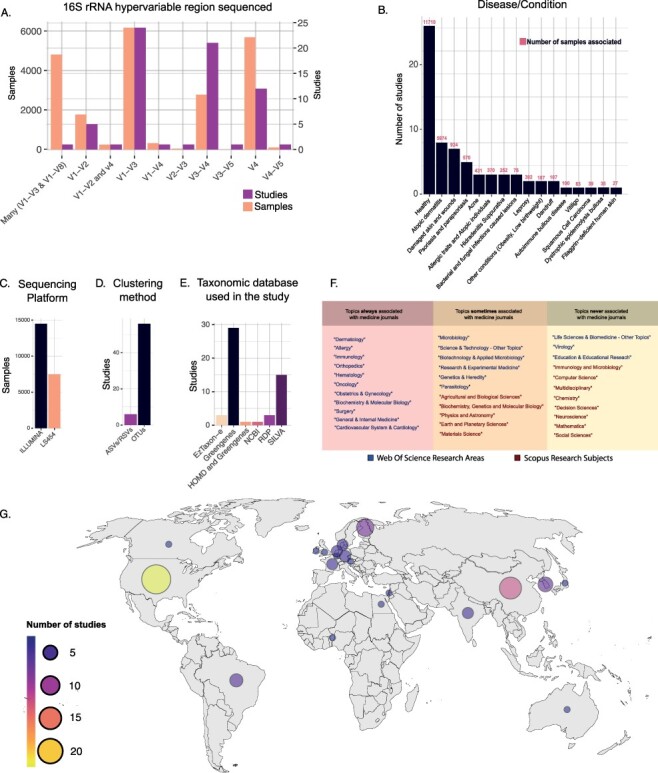
Figure 3.

(A) Number of samples and studies that used specific 16S rRNA hypervariable regions in Data Frame 3. (B) The number of studies and samples for each disease/condition investigated in Data Frame 3. (C–E) Frequency of use of the different sequencing platforms (C), clustering methods (D) and taxonomic databases (E) in Data Frame 3. (F) Table showing the WoS research areas and Scopus research subjects that described the scientific journals in which the studies of Data Frame 3 have been published. The research areas/subjects are divided into three boxes depending on how often they were associated with the Scopus research subject ‘Medicine’. Going from left to right are shown the research areas/subjects that were always (left), sometimes (center) and never (right) associated with the Scopus research subject ‘Medicine’. (G) Geographical distribution of the studies included in Data Frame 3.
