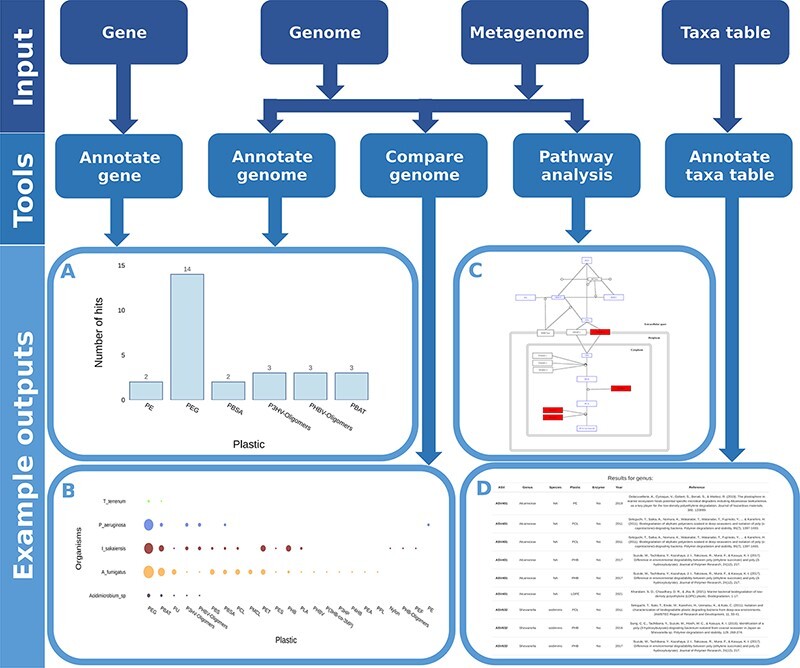
Figure 5.

Flow chart showing all possible inputs, respective tools and example outputs for each data type. A) The Ideonella sakaiensis genome was used as an input for the ‘Annotate Genome’ tool, showing the number of input proteins that matched database proteins, grouped by plastic type. B) Comparison of plastic biodegradation potential for the genomes of Ideonella sakaiensis, Agaricus bisporus, P. aeruginosa and Aspergillus fumigatus. C) The P. aeruginosa genome was also used as the input for the ‘Pathway Analysis’ tool. Open blue rectangles represent substrates, solid red rectangles represent proteins in the pathway present in the P. aeruginosa genome, and open black rectangles represent proteins not present in the genome. D) An example output table generated by the ‘Annotate Taxa Table’ tool using amplicon sequencing data as the input. All figures are available at higher resolution in the supplementary material.
