
Figure 7.
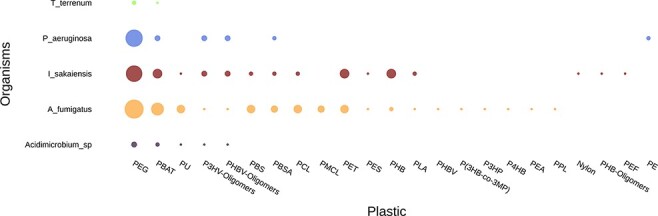
Example graph output from the ‘Compare Genome’ tool. The tool plots the number of hits for putative plastic-degrading proteins per plastic type for each dataset. The size of the dots represents the number of hits found in each genome for each plastic. The input data were the genomes of Thermobaculum terrenum, Pseudomonas aeruginosa, Ideonella sakaiensis, Aspergillus fumigatus and Acidimicrobium sp.