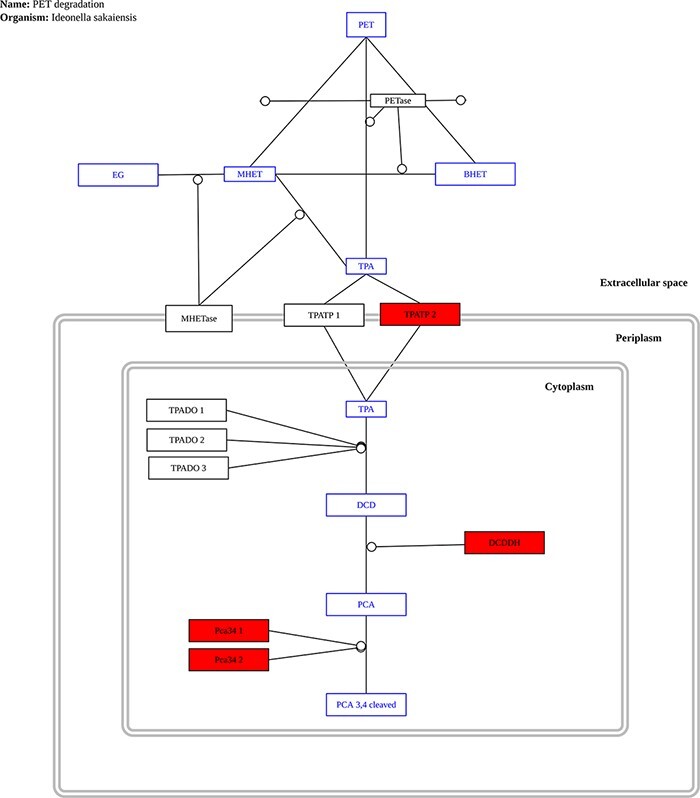
Figure 8.

Example graph output from the ‘Pathway Analysis’ tool. Black rectangles represent proteins, blue rectangles represent substrates and red rectangles represent proteins present in the genome or metagenome being investigated, in this case, the genome of the bacterium P. aeruginosa.
