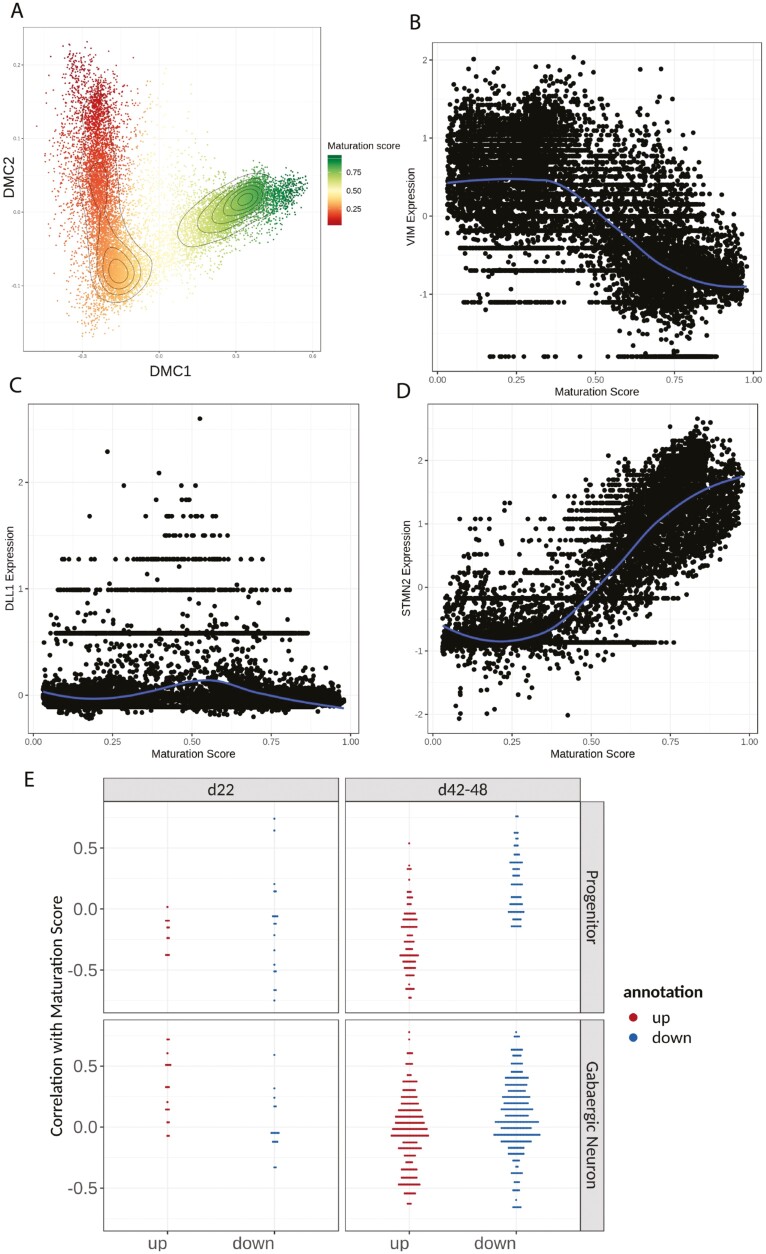
Figure 6.
Maturation score based on differentiation trajectory showed FXS cells had lower maturation scores in GABAergic neuron clusters on day 48. (A) Diffusion map representation of the scRNA-seq dataset based on the first 2 components. Colors are coded by the maturation score. (B-D) Scatter plots of normalized expression (centered around 0) of key marker genes. The gene expression from each cell was plotted against the maturation score. (B) VIM marks neural progenitors and shows the highest expression in cells with low maturation scores. (C) DLL1 marks intermediate progenitors, and its expression peaked in cells that have mid-level maturation scores. (D) STMN2 marks neurons and has the highest expression in cells with high maturation scores. (E) Correlation of gene expression to maturation score was plotted against upor downregulated genes. On day 22, the correlation of DEG genes were randomly distributed. On days 42-48, especially in the progenitor cluster, upregulated genes in FXS were negatively correlated with the maturation score, while downregulated genes in FXS were positively correlated with maturation score.

