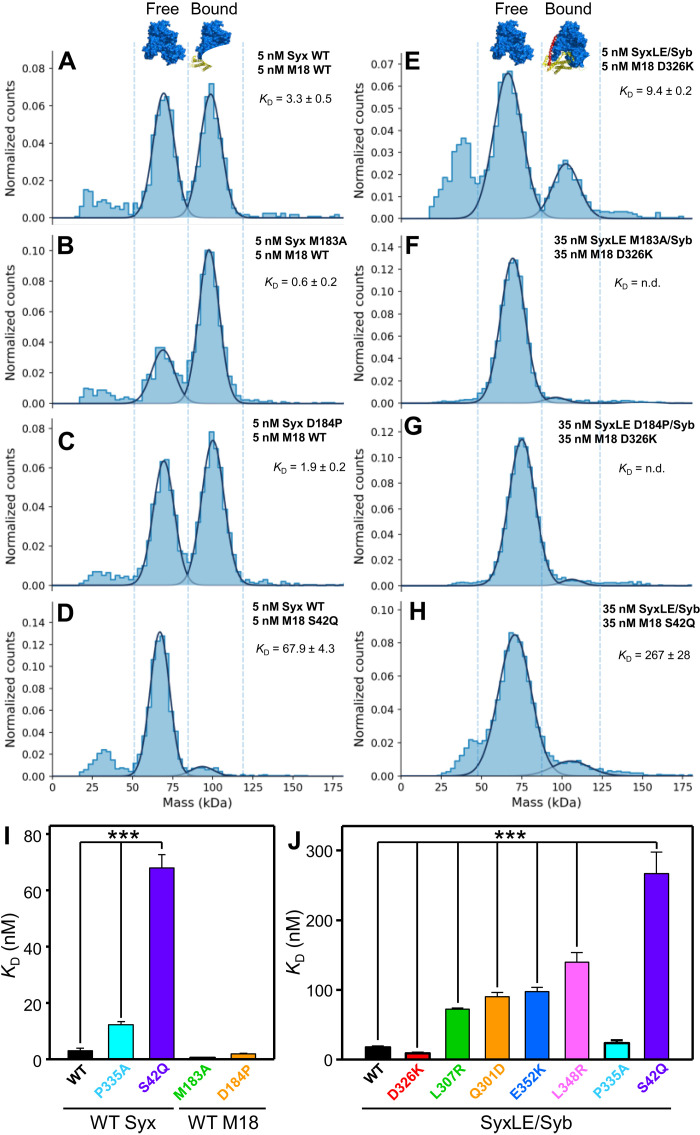
Fig. 4. Analysis of Munc18-1–SNARE interactions by mass photometry.
(A to H) Normalized histograms of mass distributions observed for samples containing the indicated concentrations of WT or mutant Munc18-1 (M18) plus WT or mutant syntaxin-1 (2–253) (Syx) (A to D), or mutant Munc18-1 plus SyxLE/Syb with or without the M183A or D184P mutations (E to H). Gaussian fits (solid lines) were used to calculate the populations of free and bound Munc18-1 and derive dissociation constants (KD’s). Binding of Munc18-1 D326K to SyxLE M183A/Syb and SyxLE D184P/Syb was too weak to derive reliable KD’s. (I and J) Bar diagrams illustrating the average KD’s (table S3) obtained from six independent experiments for samples containing WT or mutant Munc18-1 plus WT or mutant syntaxin-1 (2–253) (I), or WT or mutant Munc18-1 plus SyxLE/Syb with or without the M183A or D184P mutations (J). Error bars represent SDs. Statistical significance and P values were determined by one-way analysis of variance (ANOVA) with the Holm-Sidak test (***P < 0.001).

