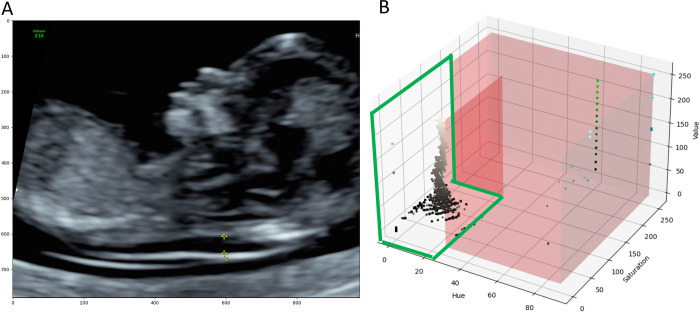
Fig 2. Identifying image annotations on a normal NT scan.
(A) Image annotations included calipers, text, icons, and profile traces, all of which were removed prior to model training. (B) 3D Scatter Plot of HSV image data. Each point represents one image pixel and its associated HSV values. The red region highlights the range of values which do not belong to the grayscale ultrasound image. The area encircled in green shows pixel values that belong to the grayscale ultrasound image. Grayscale images had H, S and V values ranging from 0–27, 0–150 and 0–255, respectively.

