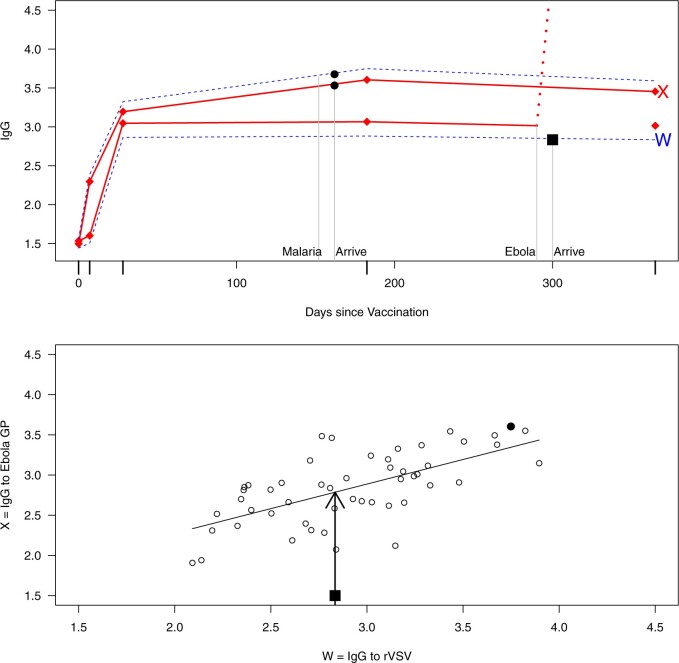
Fig. 1.
Top panel: IgG immune responses over time for two vaccinated volunteers from Prevail 1. The solid bent line is the linear interpolation of X = IgG to Ebola GP measured at weeks 0, 1, 4, 26, and 52 (red diamonds). The dotted red line is hypothetical X to reflect Ebola infection. The dashed bent line is hypothetical W=IgG to rVSV vector. The subject infected with malaria arrives with  similar to those at infection. Only
  is similar to the value prior to infection for the Ebola infected volunteer. Bottom panel: a scatter plot of
  for the controls (circles) with imputation of
  for the Ebola case (solid square).

