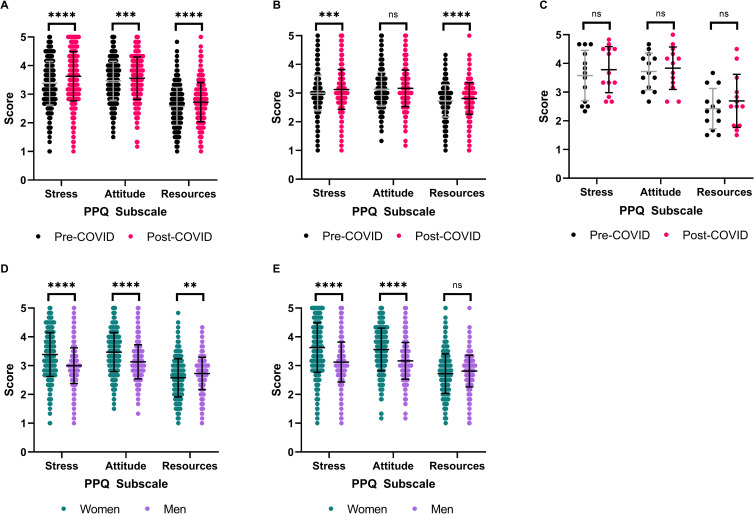
Fig 4. Differences in publication pressure questionnaire subscale scores stratified by gender.
Paired (A-E) and independent (D-E) Student’s t-test with Bonferroni correction. ** P≤0.01, *** P≤0.001, **** P≤0.0001. (A) Respondent Scores from Women. N = 484. (B) Respondent Scores from Men. N = 462. (C) Respondent Scores from non-binary or genderfluid people. N = 13. (D). Pre-COVID subscale score comparison between women and men. N = 462–484. (E) Post-COVID subscale score comparison between women and men. N = 462–484.

