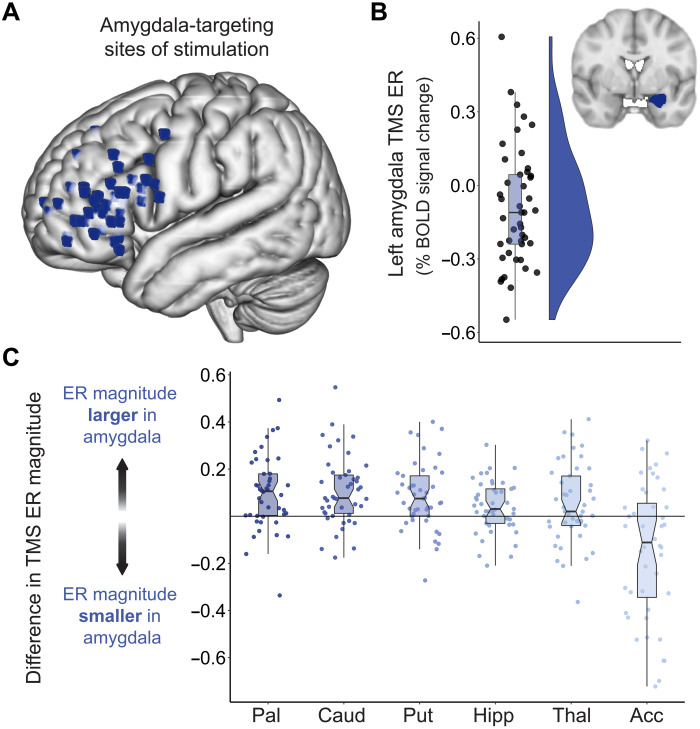
Fig. 2. Amygdala BOLD signal change following TMS administered to vlPFC connectivity peaks.
(A) Each participant’s amygdala-targeting TMS stimulation site visualized in standard (MNI) space. Individual-specific stimulation sites were localized to a left prefrontal area that was strongly functionally connected to the left amygdala and that was located directly within the vlPFC, or in closest proximity to the vlPFC of all connectivity peaks. (B) TMS elicited a sizable fMRI response in the ipsilateral amygdala. The signed TMS evoked response (TMS ER) in the left amygdala is plotted for all participants, along with corresponding box and violin plots. TMS pulses delivered to connectivity-informed stimulation sites decreased BOLD signal in the amygdala for most participants, as indicated by negative TMS ERs. (C) To assess whether amygdala-targeted TMS elicited larger functional responses in the left amygdala than in non-targeted subcortical structures, the magnitude of the TMS ER was compared between the amygdala and the left pallidum (Pal), caudate (Caud), putamen (Put), hippocampus (Hipp), thalamus (Thal), and nucleus accumbens (Acc). For each participant, the absolute valued TMS ER in these six control structures was subtracted from the absolute valued TMS ER in the amygdala, and the difference in TMS ER magnitude was plotted. Data points falling above the y = 0 line indicate that a participant had a larger amplitude TMS ER in the amygdala than in the indicated subcortical region.

