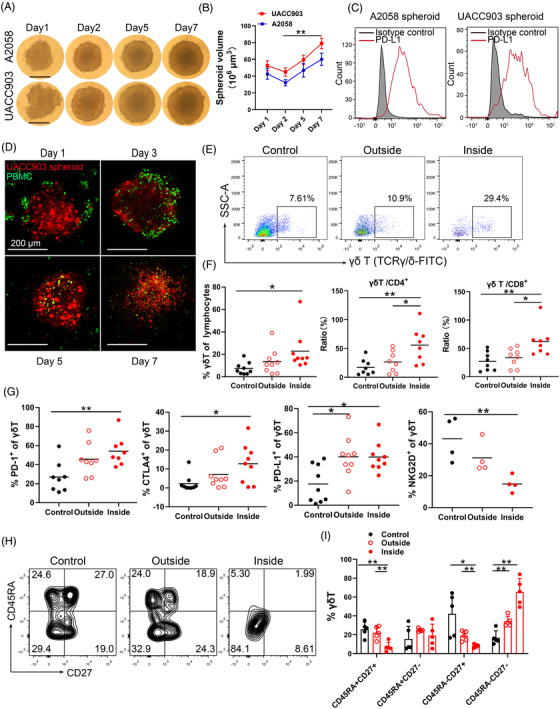
FIGURE 1.

γδ T cells infiltrate unicellular melanoma spheroids. (A) A2058 and UACC903 unicellular melanoma spheroids. 2 × 10⁴ melanoma cells were seeded in each well and spheroid images were taken. Scale bar, 200 μm. (B) Time course of unicellular spheroid growth. Spheroid size was measured using a micrometer. ** p < 0.01. (C) PD‐L1 expression in unicellular A2058 and UACC903 spheroids. The tumour spheroids were disassociated and expression of PD‐L1 was measured by FACS. (D) Co‐culture of UACC903 spheroids and peripheral blood mononuclear cells (PBMCs) with time. 2 × 10⁴ melanoma cells were labelled with Cell‐tracker orange CMTMR (red), while 4 × 10⁴ PBMCs were labelled with CFSE (green). Representative images from days 1, 3, 5, and 7 were shown. Scale bar, 200 μm. (E) Representative scatter plots of γδ T cells in the medium (outside) or inside the spheroids at day 3 after co‐culture. γδ T cells were gating on CD3+ lymphocytes. Control wells do not contain tumor spheroids. (F) Percentage of γδ T cells in lymphocytes, ratio of γδ T cells/CD4+ cells and γδ T cells/CD8+ cells at day 3 after co‐culture were showed. γδ T, CD4 T and CD8 T cells in the medium (outside) or inside the spheroids were measured by FACS. Control wells do not contain tumor spheroids. Each dot in this panel represents a unique donor. * p < 0.05; ** p < 0.01. (G) CTLA‐4, PD‐1, PD‐L1 and NKG2D expression in γδ T cells in the medium (outside) or inside the spheroids. Control wells did not contain tumour spheroids. Each dot in this panel represents a unique donor. * p < 0.05; ** p < 0.01. (H) The phenotypic subsets of γδ T cells outside or inside of the spheroids were shown in contour plots. Control wells did not contain tumour spheroids. (I) The phenotypic subsets of γδ T cell distributed in effector memory (EM, CD27‐CD45RA‐), terminal‐differentiated effector memory (TDEM, CD27‐CD45RA+), naive (N, CD27+CD45RA+), and central memory (CM, CD27+CD45RA‐) subsets. Control wells did not contain tumour spheroids. * p < 0.05; ** p < 0.01
