FIGURE 4.

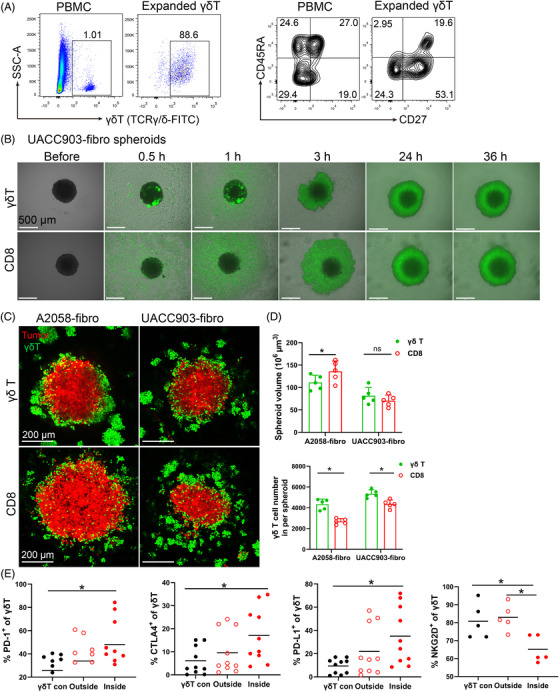
Efficacy of γδ T cell treatment in bicellular melanoma spheroids. (A) γδ T cell expansion and phenotypic subset distribution. γδ T cells were expanded from PBMCs for 10–13 days using 5 μM ZOL and 200 IU/ml IL‐2. Representative scatter plots showing expansion of γδ T cells and their phenotypic changes. (B) Time course of UACC903‐fibro spheroids co‐cultured with expanded γδ T cells and CD8 T cells were taken pictures by widefield microscopy. Scale bar, 500 μm. (C) Representative images of A2058‐fibro and UACC903‐fibro spheroid co‐culture with expanded γδ T cells or CD8+ T cells. Spheroid cells were labelled with orange dye (red), γδ T cells and CD8+ T cells were labelled with CFSE (green). Scale bar, 200 μm. (D) The size of A2058‐fibro and UACC903‐fibro spheroid and the infiltrating cell number was analysed after co‐culture with expanded γδ T cells or CD8+ T cells. n = 5; *p < 0.05; ns, no significant difference. (E) Proportion of γδ T cells and their CTLA‐4, PD‐1, PD‐L1 and NKG2D expression on γδ T cells in the medium (outside) or inside of A2058‐fibroblast spheroids were measured by flow cytometry. γδ T con: expanded γδ T cells without spheroids. n = 5–10; *p < 0.05. The γδ T cells and CD8+ T cells were from the same donors
