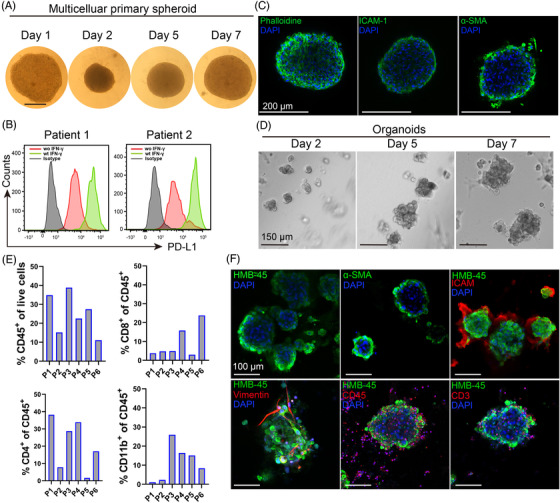
FIGURE 5.

Patient‐derived multicellular spheroids and melanoma patient‐derived organoids (MPDOs). (A) Time course of patient‐derived multicellular spheroid growth. The adherent cultured cells from disassociated fresh patient melanoma tissues were digested and seeded on the agarose for 48 h to form multicellular spheroids. Images were taken by microscopy. Scale bar, 250 μm. (B) PD‐L1 expression in patient‐derived multicellular spheroid (patient 1 and patient 2) with or without IFN‐γ stimulation (50 ng/ml) was measured by FACS after spheroids were disassociated into single cells. (C) Immunofluorescent staining of Phalloidine, ICAM‐1 and α‐SMA in patient‐derived multicellular spheroid. Scale bar, 200 μm. (D) Representative images of MPDOs grew on the matrigel over time. Images were taken at days 2, 5, and 7. Single cells derived from fresh patient melanoma tissues were seeded onto the matrigel and cultured. Scale bar, 150 μm. (E) Cellular components of CD45+, CD8+, CD4+ and CD11b+ cells in the MPDOs were measured by flow cytometry. P1–P6, patient 1 to patient 6. (F) Immunofluorescent staining of HMB‐45, α‐SMA, ICAM‐1, Vimentin, CD45+ and CD3+ T cells in MPDOs. Scale bar, 100 μm
