. 2022 Jun 22;11:e74342. doi: 10.7554/eLife.74342

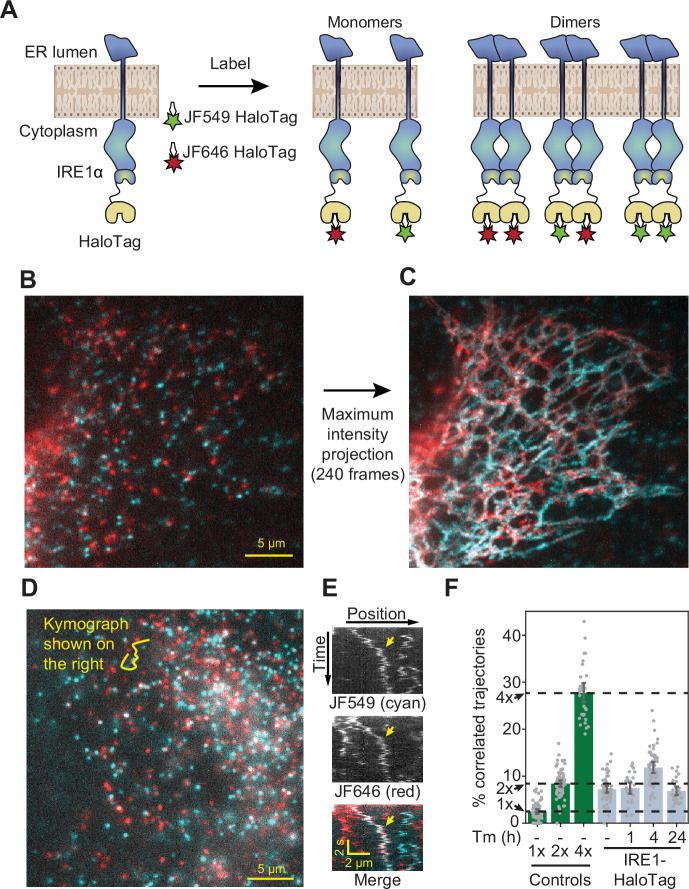
Figure 3. Detection of IRE1 dimers and oligomers in live cells.

(A) Schematic depiction of the assay. IRE1-HaloTag is simultaneously labeled with HaloTag dyes of two different colors, JF549 and JF646. If the protein is purely monomeric, all single-molecule tracks are expected to be either one color or the other. If it is purely dimeric, a fraction of tracks will contain both colors. Such dual-color tracks can then be identified as correlated trajectories. (B) Single frame from a long-exposure movie (100ms per frame) of a cell in which IRE1-HaloTag is labeled with a mixture of JF549 (cyan) and JF646 (red) dyes. (C) Maximum intensity projection of the entire movie from panel B showing that single IRE1 molecules diffuse along ER tubules. (D) Single frame from a short-exposure movie (50ms per frame) of a cell in which IRE1-HaloTag is labeled with a mixture of JF549 (cyan) and JF646 (red) dyes. (E) Kymograph (time vs. position plot) along the line shown in panel D. Co-localizing diffusional IRE1 trajectory is shown with a yellow arrow. (F) Stress-induced changes in IRE1 oligomerization in response to treatment with 5 μg/ml tunicamycin (Tm), as quantified by the fraction of correlated trajectories. Green bars on the left correspond to the 1 x, 2 x, and 4 x HaloTag controls, respectively. Error bars represent 95% confidence intervals.

Figure 3—source data 1. Pairwise significance test values (permutation test with 10,000 iterations and two-tailed t-test) for conditions plotted in Figure 3F.

Figure 3.

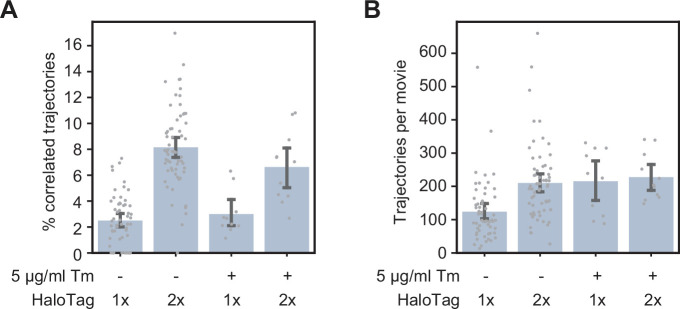
Figure 3—figure supplement 1. Effect of ER stress on HaloTag controls.

Figure 3—figure supplement 1.

(A) Single-particle tracking data showing the fraction of correlated trajectories for the 1 x and 2 x HaloTag controls, with and without a 4-hr treatment with tunicamycin. (B) Number of trajectories per movie for the four conditions shown in panel A, demonstrating that the changes in % correlated trajectories are independent of construct expression levels. Each data point represents a single cell. Error bars represent 95% confidence intervals.
Figure 3—figure supplement 1—source data 1. Pairwise significance test values (permutation test with 10,000 iterations and two-tailed t-test) for all plotted conditions.
Figure 3—figure supplement 2. Effect of ER stress on the efficiency of HaloTag labeling.

Figure 3—figure supplement 2.

Single-particle tracking data showing the fraction of correlated trajectories for the 1 x, 2 x, and 4 x HaloTag controls, as well as endogenously tagged IRE1-HaloTag cells with dye added at different times relative to the induction of ER stress. ‘Before’ indicates that cells were first treated with tunicamycin and then labeled with a mixture of JF549 and JF646 dyes, while ‘after’ indicates that cells were first labeled with the dye mixture and then stressed with tunicamycin. Each data point represents a single cell. Error bars represent 95% confidence intervals.
Figure 3—figure supplement 3. Quantification of diffusion from single-particle trajectories.
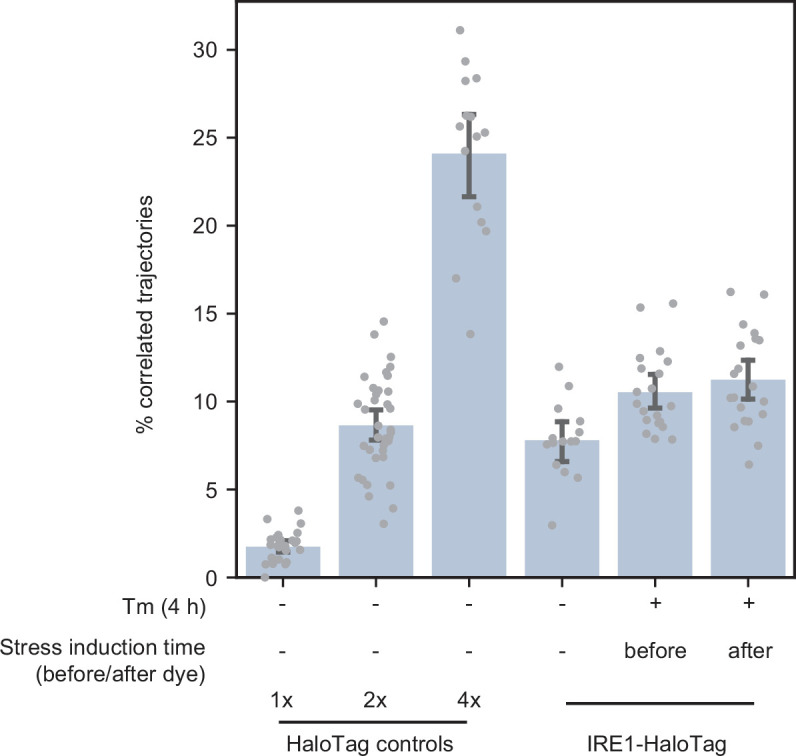
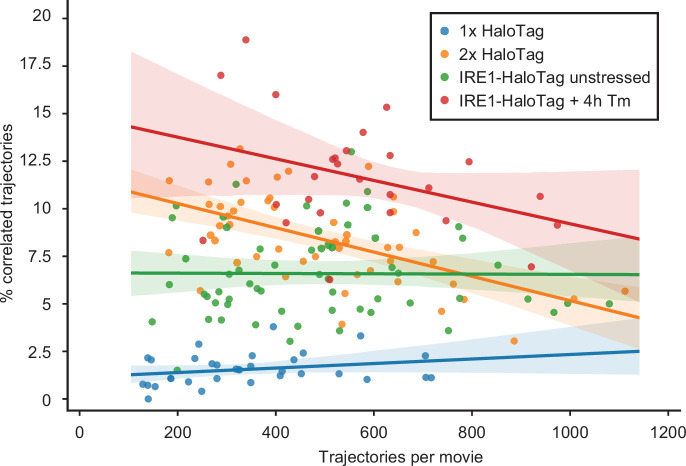
Figure 3—figure supplement 3.

(A) Kernel density estimates of apparent diffusion constants of HaloTag controls and IRE1-HaloTag with and without stress, obtained by conventional MSD analysis of single particle trajectories. (B) Mean posterior occupation of single-particle diffusion constants of the same four conditions as shown in panel A (see Materials and methods for details).
Figure 3—figure supplement 3—source data 1. Pairwise significance test values (permutation test with 10,000 iterations and two-tailed t-test) for all plotted conditions.