. 2022 Jun 22;11:e74342. doi: 10.7554/eLife.74342

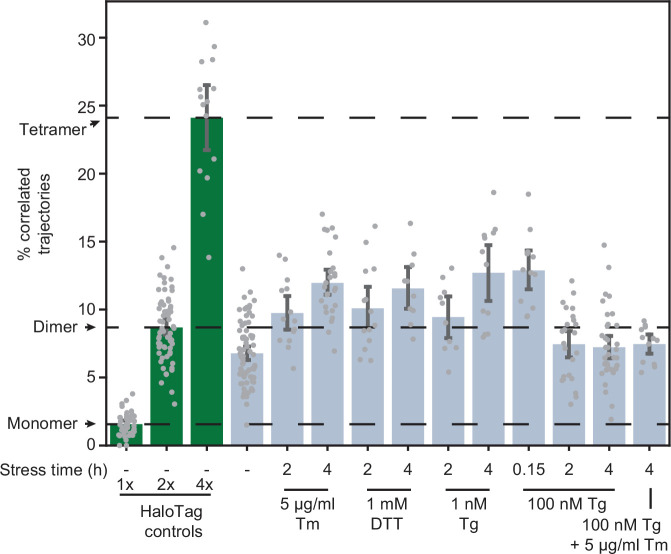
Figure 4. Effects of stressors on IRE1 oligomerization.

Oligomerization of endogenously tagged IRE1-HaloTag in U-2 OS cells treated with the indicated ER stressors for the indicated amounts of time. Tunicamycin (Tm) inhibits glycosylation in the ER lumen, thapsigargin (Tg) blocks sarco/endoplasmic reticulum Ca2+ pumps, and dithiothreitol (DTT) triggers reduction of disulfide bonds. Green bars on the left correspond to the 1 x, 2 x, and 4 x HaloTag controls, respectively. Error bars represent 95% confidence intervals.

Figure 4—source data 1. Pairwise significance test values (permutation test with 10,000 iterations and two-tailed t-test) for all plotted conditions.

Figure 4.

Figure 4—figure supplement 1. Formation of dimers and oligomers in high- and low-expressing clones of IRE1-HaloTag cells.
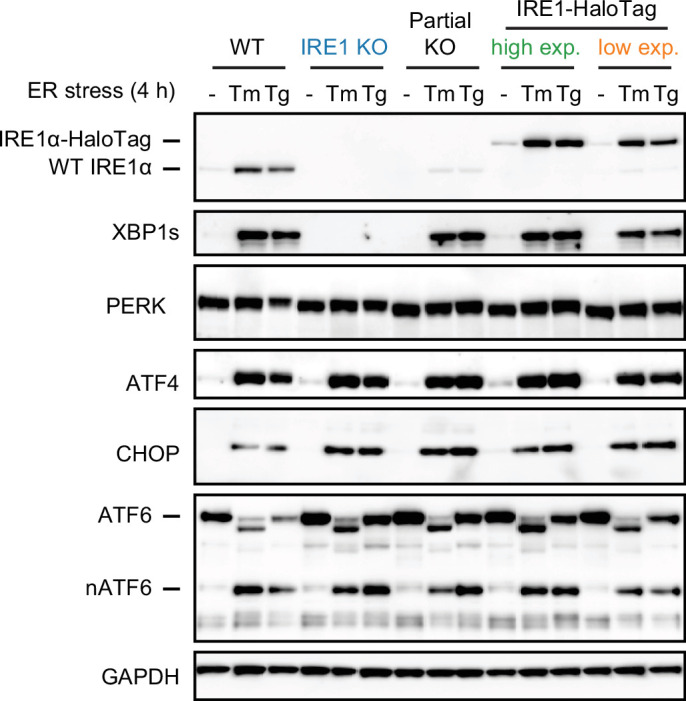
Figure 4—figure supplement 1.

Single-particle tracking data showing stress-dependent oligomerization of the high- and low-expressing IRE1-HaloTag clones. IRE1 in the lower-expressing clone remains dimeric in unstressed cells, while the shift to higher-order oligomers upon stress is less prominent than in the higher-expressing clone. Each data point represents a single cell. Error bars represent 95% confidence intervals.
Figure 4—figure supplement 1—source data 1. Raw uncropped gel of immunoblot against IRE1, XBP1s, and GAPDH of Figure 4—figure supplement 1.
Figure 4—figure supplement 1—source data 2. Raw uncropped gel of immunoblot against PERK, ATF4, and CHOP of Figure 4—figure supplement 1.
Figure 4—figure supplement 1—source data 3. Raw uncropped gel of immunoblot against ATF6 of Figure 4—figure supplement 1.
Figure 4—figure supplement 2. Trajectory density vs. percent correlation.
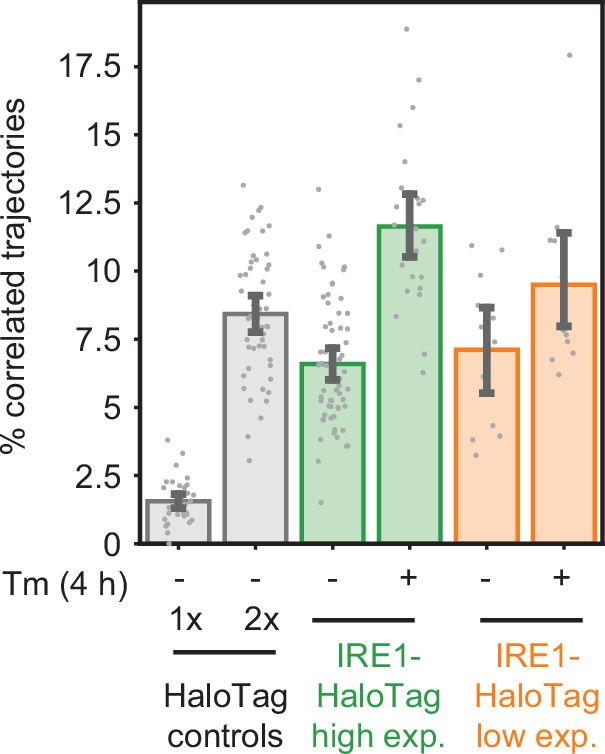
Figure 4—figure supplement 2.

A plot showing the relationship between the percentage of a calculated trajectories in a given cell against the number of trajectories in the movie collected from that cell, for the four conditions indicated in the box. Solid lines represent linear fits, with the shaded regions around them showing 95% confidence intervals. Each data point represents a single cell.
Figure 4—figure supplement 2—source data 1. Pairwise significance test values (permutation test with 10,000 iterations and two-tailed t-test) for all plotted conditions.