. 2022 Jun 22;11:e74342. doi: 10.7554/eLife.74342

Figure 5. Effects of mutations on IRE1 oligomerization.

Oligomerization of the indicated IRE1 mutants transiently transfected into IRE1 KO U-2 OS cells and expressed under the control of the weak CMVd3 promoter. ‘IRE1-HaloTag (endogenous)’ refers to the endogenously tagged IRE1 cells that are shown in Figure 4. Error bars represent 95% confidence intervals.

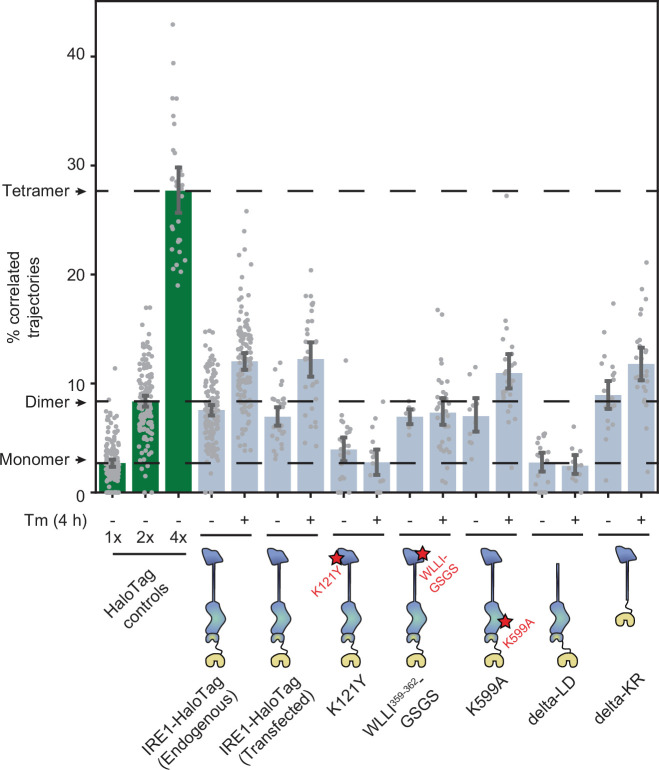
Figure 5—source data 1. Pairwise significance test values (permutation test with 10,000 iterations and two-tailed t-test) for all plotted conditions.

Figure 5.

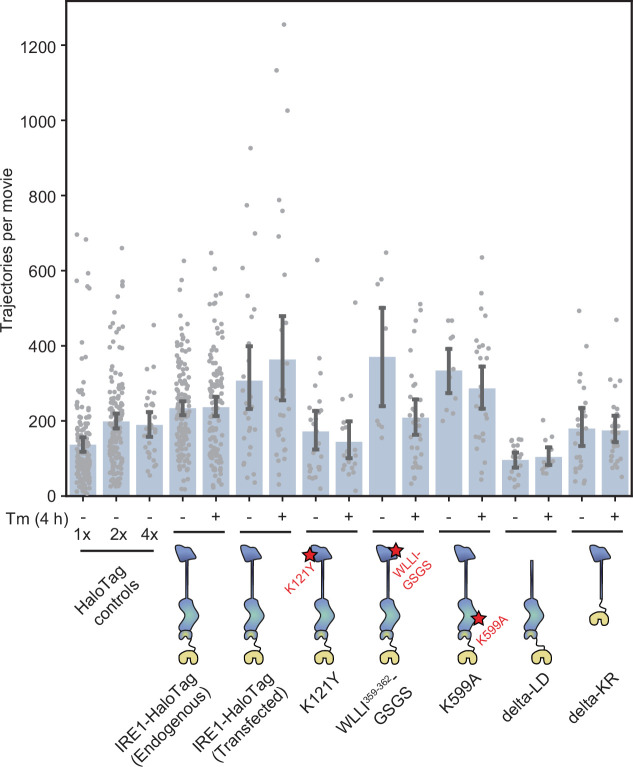
Figure 5—figure supplement 1. Trajectory counts of all mutants.

Figure 5—figure supplement 1.

Number of trajectories per movie for all mutants shown in Figure 5, demonstrating that all constructs are expressed at comparable levels and that the changes in % correlated trajectories are independent of construct expression levels. Each data point represents a single cell. Error bars represent 95% confidence intervals.