. 2022 Jun 22;11:e74149. doi: 10.7554/eLife.74149

Figure 2. Model parameters.

(A) Posterior distributions of the parameters’ group-level means for each group (left and right panels). Parameters αno-pain and αpain are learning rates for avoided and received pain outcomes, respectively; parameter β is the inverse-temperature parameter. The middle panels are joint density plots of α-pain and α-no-pain (dots are samples from the Markov chain Monte Carlo [MCMC]), showing that α-pain is reliably greater than α-no-pain in the placebo group only. (B) The difference between the posterior distributions for each drug group vs. the placebo group, showing that α-no-pain is greater and β- is smaller in both drug groups compared to the placebo group. Red lines indicate 95% highest density intervals (HDIs).

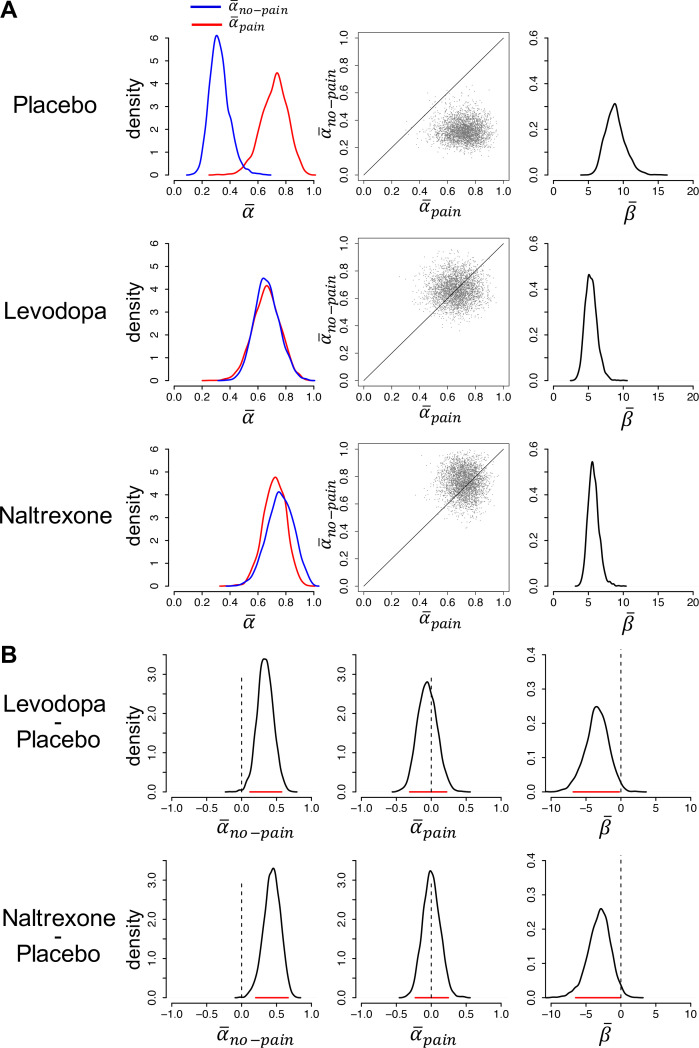
Figure 2—source data 1. The 95% highest density intervals (HDIs) of the posterior distributions of each participant’s learning rate for pain (αpain) and no-pain (αnopain) outcomes.

Figure 2.

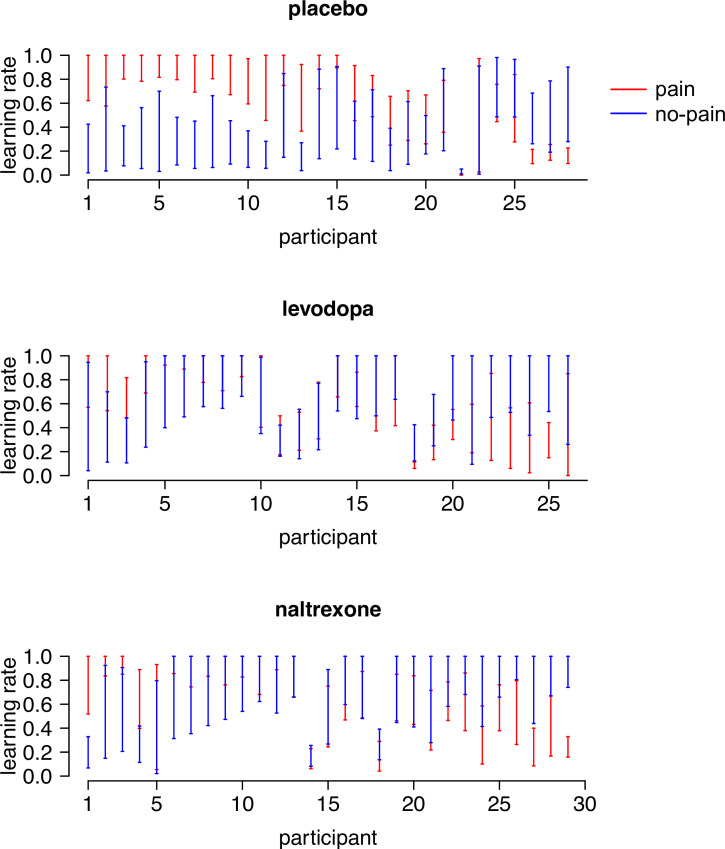
Figure 2—figure supplement 1. The 95% highest density intervals (HDIs) of the posterior distributions of each participant’s learning rate for pain ( αpain) and no-pain (αnopain) outcomes.

Figure 2—figure supplement 1.

Participants are sorted according to the difference between their two learning rates (αpainαno-pain). Note that αpain and αno-pain were positively correlated in the levodopa group (r = 0.43, p = 0.03), but were not correlated in the placebo (r = −0.16, p = 0.4) and naltrexone (r = 0.31, p = 0.10) group.
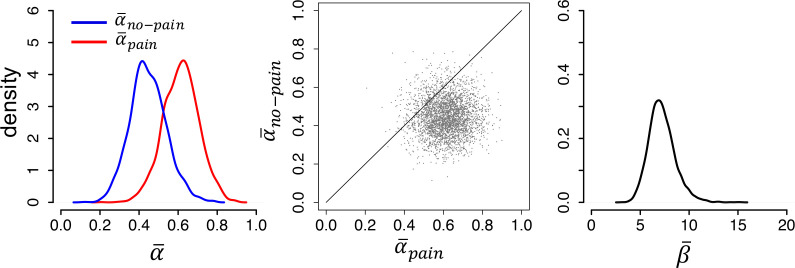
Figure 2—figure supplement 2. Modeling results from an independent sample of untreated participants from a previous study (N = 23), replicating the asymmetric learning rates (α-pain > α-no-pain) found in our placebo group.

Figure 2—figure supplement 2.