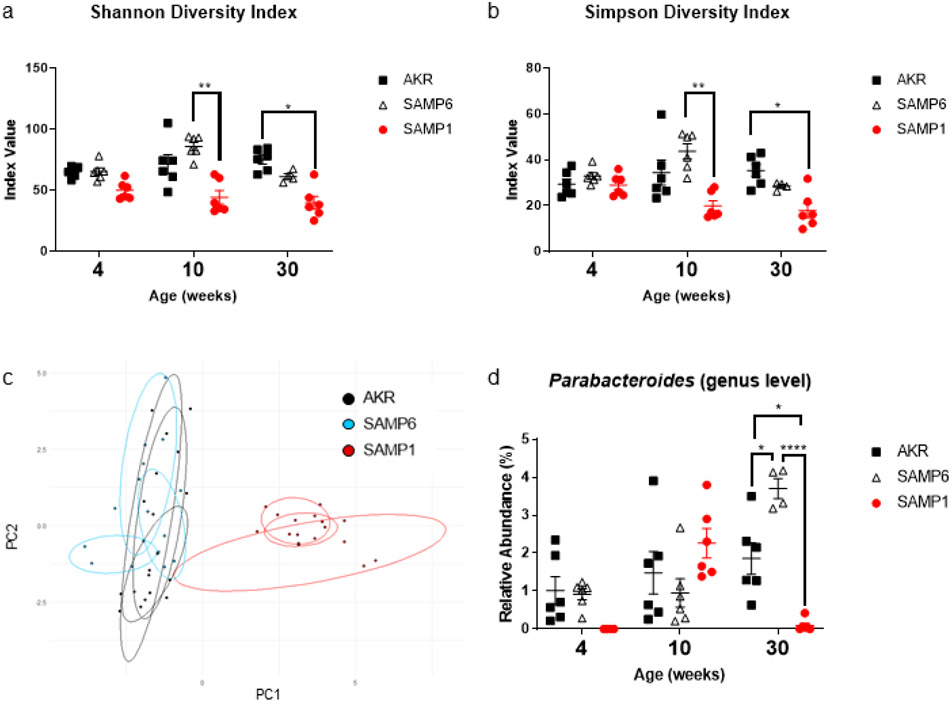
Figure 2. Depressive-like behavior in SAMP6 mice is associated with expansion of Parabacteroides.
16s rRNA analysis of the fecal microbiome revealed some changes in the richness and evenness of the samples as measured by the (a) Shannon and (b) Simpson diversity indices. (c) Principal component analysis (PCA) of the fecal microbiomes over time. Principal component 1 and 2 shown here accounting for ~39% of explained variance. (d) 16s rRNA measured relative abundance of Parabacteroides. Pairwise Wilcoxon Rank Sum tests performed to analyze data; bars indicate mean ± S.E.M. (*p < 0.05, **p < 0.01, and ****p < 0.0001).

