Figure 4:

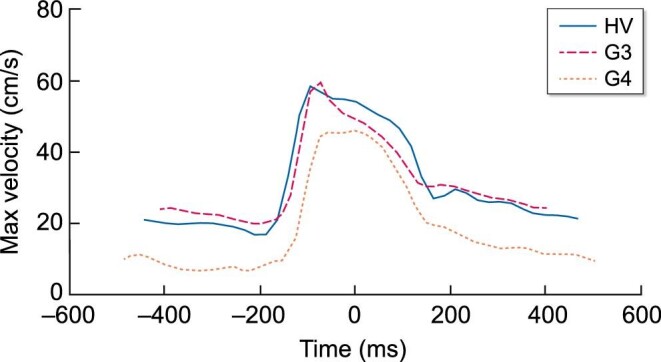
Representative phase contrast flow profiles through the cardiac cycle showing maximum velocity in the renal artery from a HV, stage G3 and stage G4 subject.

Representative phase contrast flow profiles through the cardiac cycle showing maximum velocity in the renal artery from a HV, stage G3 and stage G4 subject.