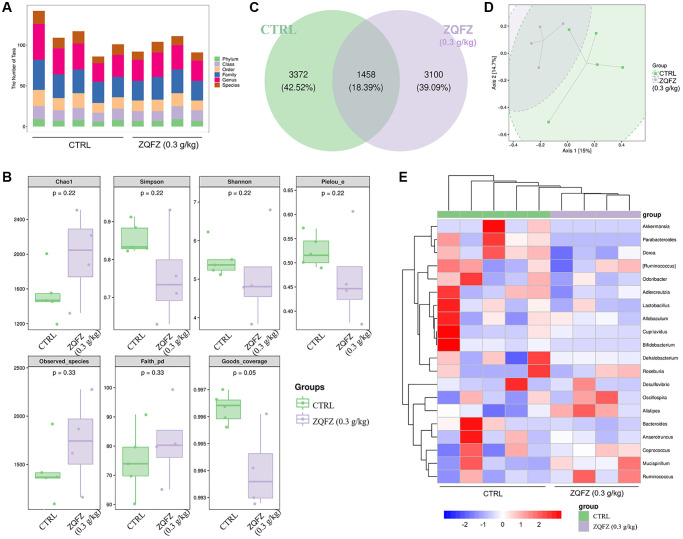
Figure 2.
ZQFZ regulated the intestinal microflora. (A) Statistical chart of microbial taxon (B) Chao1, Simpson, Shannon, Pielou’s evenness, observed species, Faith’s phylogenetic diversity and Good’s coverage index values from alpha diversity analysis of the two groups. (C) Venn diagram. (D) PCoA of beta diversity analysis. (E) Heatmap of the 20 bacterial genera with the most significantly different abundance, clustered for UPGMA according to euclidean distance of species composition data. Data are expressed as the mean (n = 4 or 5 mice/group).

