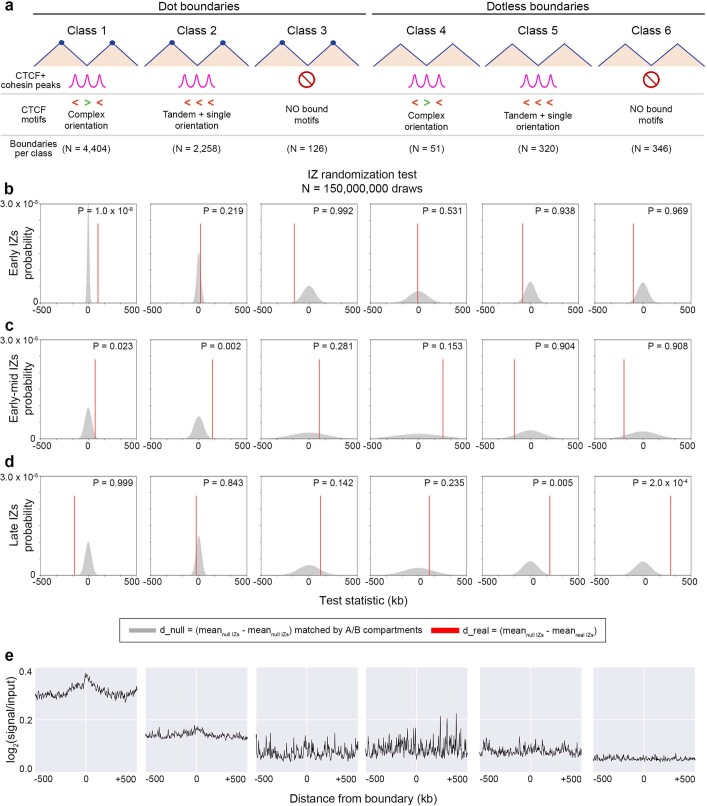
Extended Data Fig. 5. Statistical test and SNS-seq in H1 human ES cells reveals the enrichment of Early IZs at class 1 boundaries.
(a) Boundary classification schematic in human ES cells with the following boundary counts: (i) N = 4,404, (ii) N = 2,258, (iii) N = 126, (iv) N = 51, (v) N = 320, (vi) N = 346. Boundary class numbers in figure and caption provided for autosomal chromosomes only. (b-d) Statistical test computing proximity of IZs to TAD/subTAD boundaries compared to expectation in hES Hi-C autosomes. We computed right-tailed, one-tailed empirical p-values using a randomization test with (b) early, (c) early-mid, and (d) late S phase IZs and size- and A/B compartment-matched null IZs (Supplemental Methods). Test statistic for real IZs (red line) represents the difference between the average null IZ distance to closest boundary and average real IZ distance to closest boundary (detailed in Supplemental Methods). Null distribution represents the difference between the average distance to the closest boundary of two reshuffled sets of null IZs. (e) We plotted the average SNS-seq signal (reads per million) 500 kb up- and down-stream of the 6 boundary classes. SNS-seq data in human ES cells was acquired from Besnard et al51. The overall level of SNS-seq signal at Dot boundaries was also higher than Dotless boundaries, reinforcing the shared propensity of SNS-seq origins and corner-dot TADs/subTADs to both be enriched in the same genomic compartment (A compartment), which we controlled for in our statistical tests.

