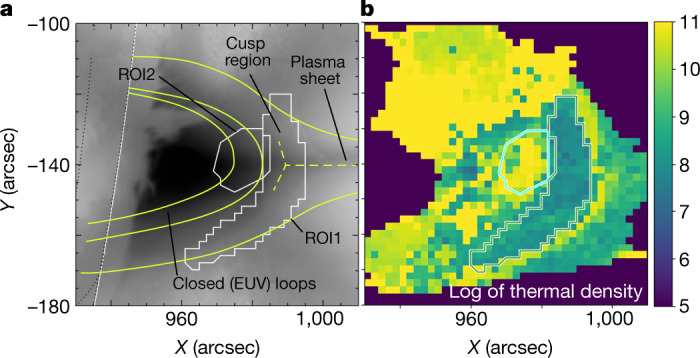
Fig. 1. Thermal plasma in the context of magnetic morphology in the 10 September 2017 solar flare.

a, The plot shows EUV brightness distribution (image) in the context of the hand-drawn magnetic field lines outlining closed, post-reconnection loops, cusp region including a so-called Y-point and the vertical plasma sheet. ROI1 and ROI2 used in the analysis are also shown. b, Distribution of the median values of the thermal plasma density, log scale, obtained from the microwave data using MCMC simulations; see Methods. Strong depletion of the thermal number density is apparent inside ROI1.
