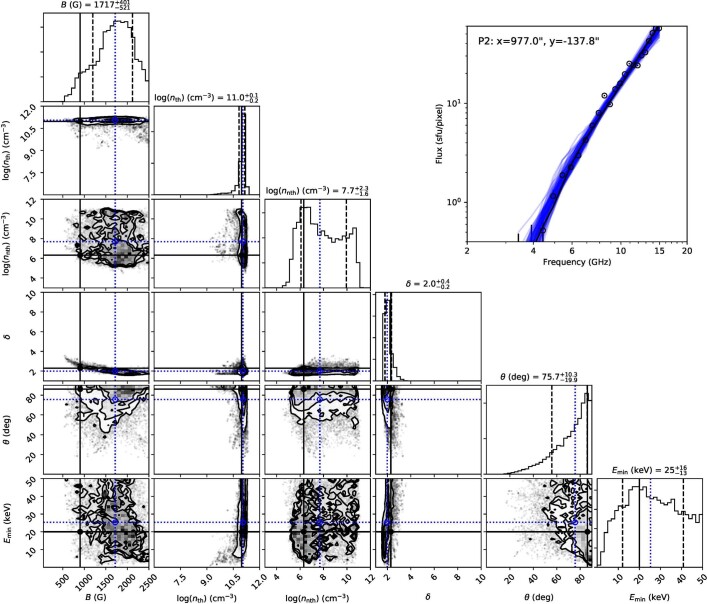
Extended Data Fig. 2. MCMC probability distributions of the fit parameters for an example pixel in ROI2.
The results are for pixel P2 located at x = 977.0″ and y = −137.8″, as marked in Extended Data Fig. 1. Solid black horizontal/vertical lines in each panel indicate the best-fit values from the GSFIT minimization. Dotted blue horizontal/vertical lines mark the median values of the MCMC probability distributions. Dashed lines in the histograms along the diagonal indicate ±1-sigma standard deviation of a given parameter. Off-diagonal panels show correlations between all possible pairs of parameters shown as 2D histograms of the probability distributions. The contours represent 39.3%, 60% and 80% of the maximum. The outer contour is selected to represent approximately the 1-sigma region of a 2D Gaussian distribution (1 − e−0.5).

