
Figure 1.
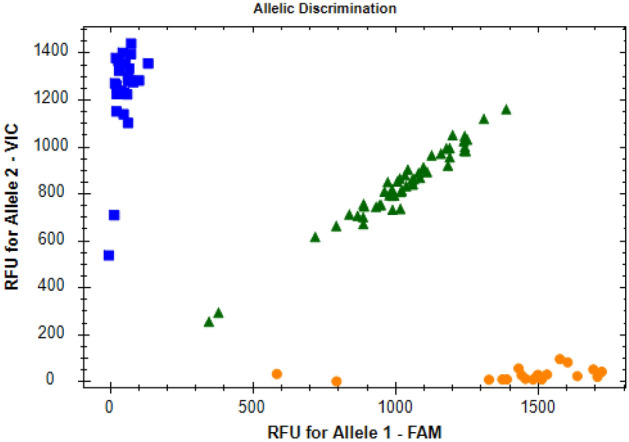
Allelic discrimination X–Y scatter-plot of the c.47 C > T (p.Val16Ala) SNP (rs4880) of the SOD2. The TaqMan® SNP Genotyping Assay (ID: C_8709053_10) was used for genotyping of this polymorphism. The X-axis represents the relative fluorescent emission for the C allele-specific probe labeled with 6-carboxyfluorescein (FAM), and the Y-axis represents the emission for the T allele-specific probe labeled with 2′-chloro-7′-phenyl-1,4-dichloro-6-carboxyfluorescein (VIC). Circles: homozygous C/C; squares: homozygous T/T; triangles: heterozygous T/C.