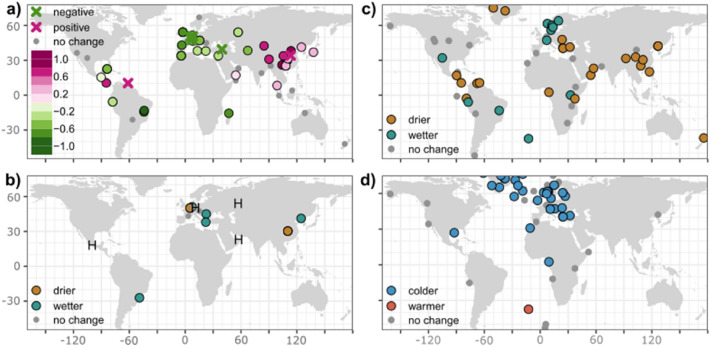
Figure 4.
(a) Oxygen isotope anomalies for the 8.2 ka event, registered by speleothem records. The 8.2 ka anomalies determined by breakpoint analysis are shown by filled circles. They are calculated as the mean δ18O value between the start and end of the event and given relative to a base period mean δ18O, defined as 7.8 ka to the event end and the start to 8.4 ka. Where studies have identified a speleothem δ18O excursion, but the raw data are not available, anomalies are simply given as positive or negative (Table S2), represented by crosses. (b) Speleothem evidence of wetter/drier 8.2 ka event conditions, inferred from non-oxygen isotope evidence. H indicates records with a hiatus spanning the 8.2 ka event and therefore assumed to record drier conditions. Metadata for these records are given in Table S3. (c, d) Inferred precipitation and temperature anomalies during the 8.2 ka event from the Morrill et al.13 synthesis.

