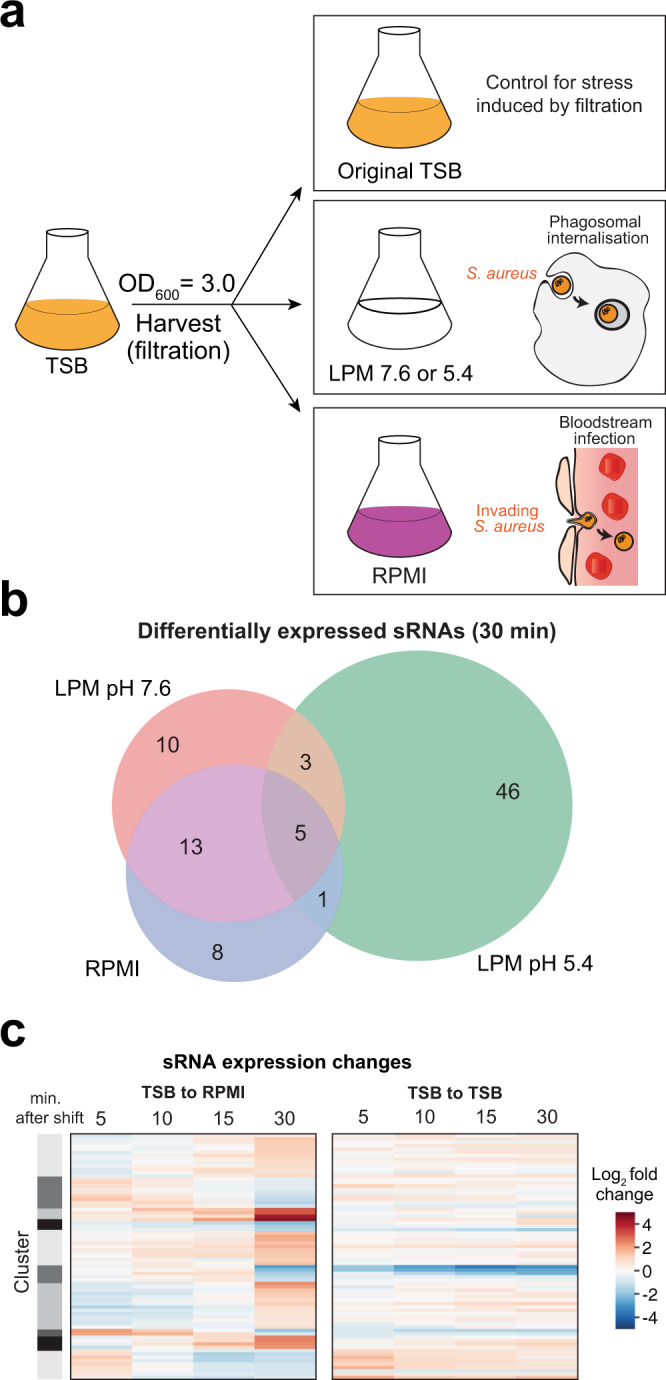
Fig. 1. Mimicking the transition to the bloodstream and intracellular environment.

a Experimental set up for shift experiments. S. aureus was grown to OD600 ~3 in TSB and harvested through vacuum filtration. Cells were then resuspended in RPMI to simulate the bloodstream or LPM pH 5.4 to simulate intracellular phagosomes. As controls, cells were shifted into LPM pH 7.6 to model for the nutritional profile of this medium, or back into their original TSB to model for any stresses incurred by the shift. b Number of sRNAs with significantly changed expression after 30 min of stress. Each stress condition is uniquely coloured, with sRNAs found in LPM pH 7.6 shown in red, LPM pH 5.4 in green and RPMI in blue. c Changes in the expression levels of individual sRNAs during the shift to RPMI and shift back to the original TSB medium. The darker the red in colour, the higher the increase in gene expression. The darker the blue in colour, the stronger the reduction in gene expression. Expression was compared to data obtained from the TSB (t = 0) sample. Only sRNAs that were differentially expressed during the time-course, according to DESeq2116, are shown.
