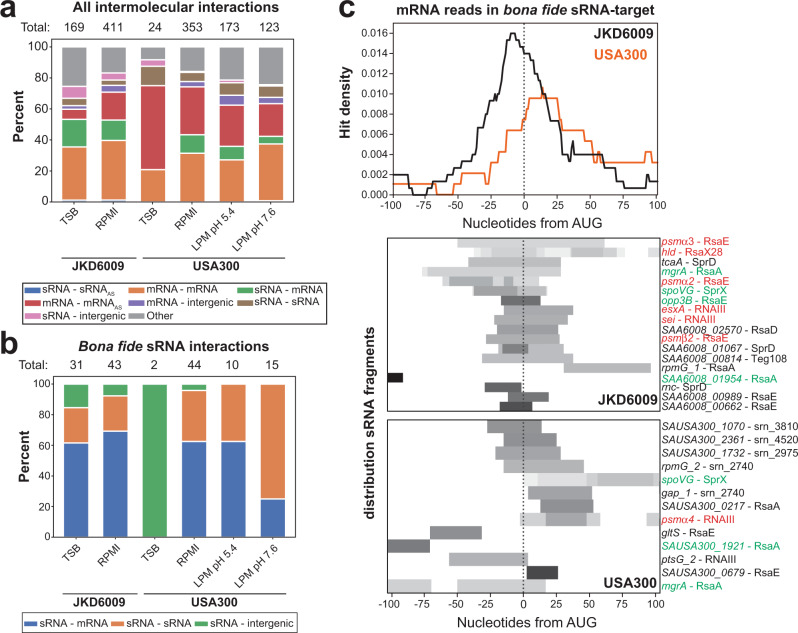
Fig. 3. RNase III CLASH captures canonical sRNA – mRNA interactions.
a Categories of identified intermolecular RNA interactions. Here, a single interaction can be represented by many hybrids. tRNA-tRNA and rRNA-rRNA chimeras were excluded due to their high sequence similarity, meaning that we could not unambiguously determine if these represented intermolecular or intramolecular interactions. “Total” indicates the total number of unique RNA-RNA interactions identified in each dataset. Colour of each stacked bar denotes the type of interaction represented. b As in a, but only for interactions containing a bona fide sRNA. c Top: distribution of the mRNA fragments in bf sRNA-mRNA interactions around the translational start codon (AUG). Orange line shows data from USA300 and the black line from JKD6009. Bottom: heatmaps showing the read distribution for the mRNA fragments for each individual interaction. Interactions highlighted in green are those that have previously been experimentally verified, and in red are those interactions involving toxins. Interactions coloured in black are other novel interactions identified in this study.

