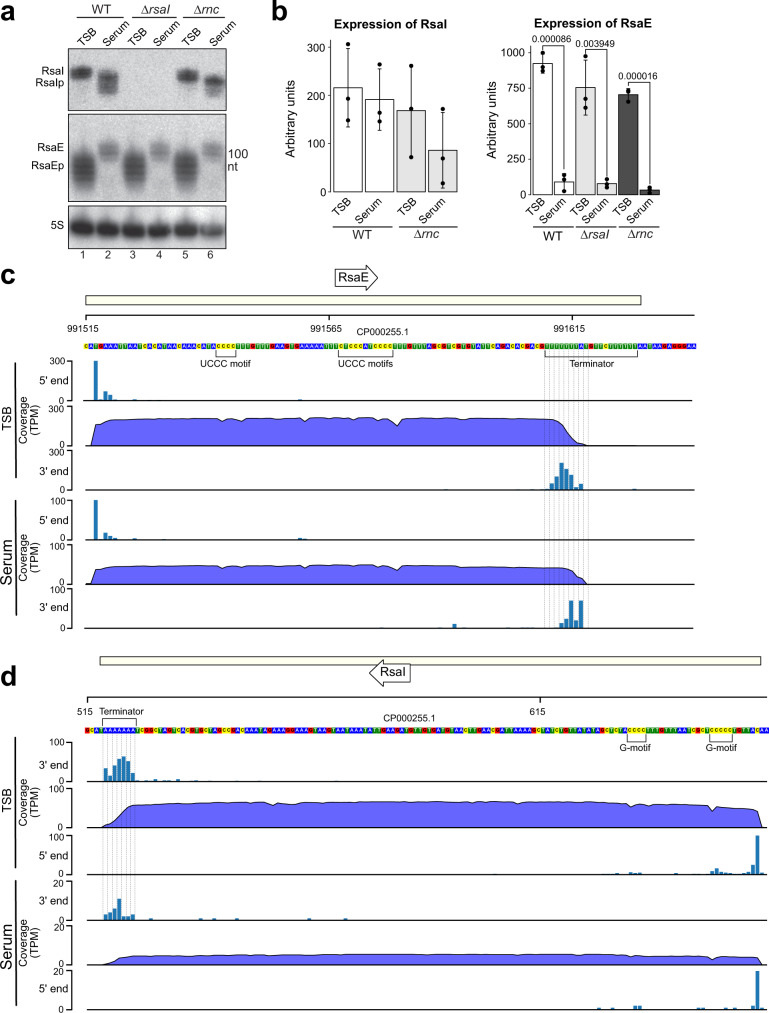
Fig. 4. RsaI and RsaE medium-dependant expression and processing.
a Northern blot analysis of USA300 parental (WT), ΔrsaI and Δrnc strains grown in TSB and human serum. Cells were grown to exponential phase in TSB, diluted in 10 mL of human serum to OD600 0.05 and grown for another 3 h. RsaIp and RsaEp indicates processed forms of the corresponding sRNAs. Three independent biological replicate experiments were performed, with a representative experiment shown here. b Quantification of the RsaE and RsaI levels represented in a. Arbitrary units indicate the signal intensities of the bands as measured by the Fuji AIDA software. Shown are the averages and standard deviation calculated from three independent replicate experiments. Values above bars display respective p value, obtained from Student’s unpaired, two-tailed t test. Images and raw data used to generate figures (a, b) are provided in the Source Data file. c Genome browser visualisation of RsaE and its mapped 5ʹ- and 3ʹ-ends, Total RNA was extracted from cells grown in TSB or human serum and then the exact sequence of RsaE was identified through Nanopore cDNA sequencing. Reads are expressed as transcripts per million (TPM). DNA nucleotides are coloured, A in blue, T in green, C in yellow and G in red. d As in c but for RsaI.

