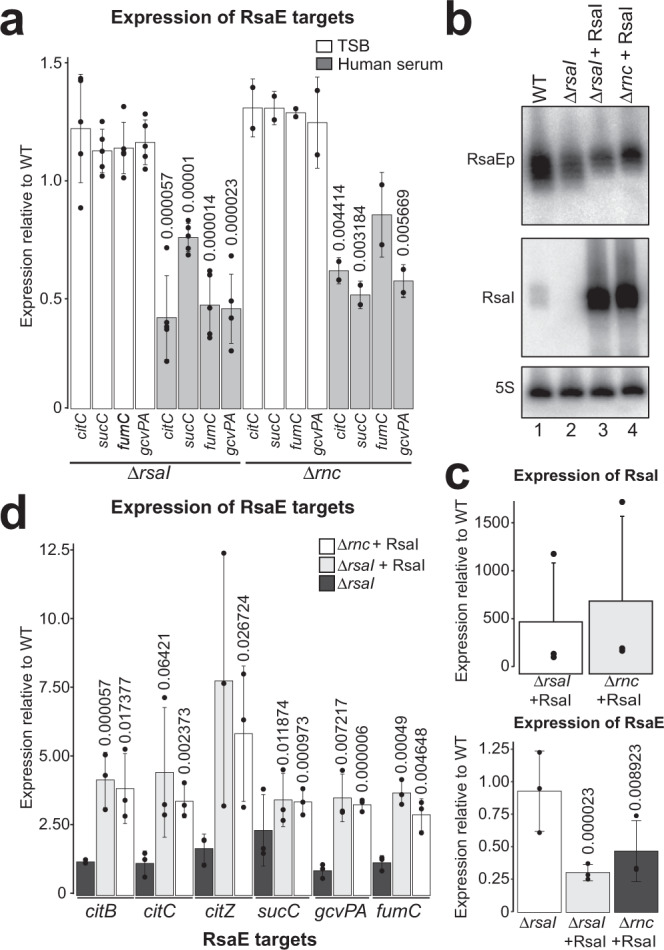
Fig. 5. RsaI and RNase III regulate RsaE activity in human serum.

a RsaI and RNase III regulate RsaE activity in human serum. Shown is the expression of RsaE targets in TSB and human serum in the ΔrsaI and Δrnc strains relative to the parental strain (USA300) as measured by RT-qPCR. Averages and standard deviation were calculated from five (ΔrsaI) or two (Δrnc) experimental replicates and three technical replicates. Values above bars display respective p value (mutant vs WT), obtained from Student’s two-tailed, unpaired t test The bar fill denotes the condition tested, white for TSB, grey for human serum. b Overexpression of RsaI and impact on the levels of RsaE. Strains (WT, ΔrsaI and ΔrsaI complemented with a plasmid expressing RsaI) were grown to OD600 ~3.0 in TSB and RNA was analysed by Northern blot analyses to detect RsaE, RsaI and 5 S rRNA. RsaEp indicates processed RsaE. Shown is a representative Northern blot results from three independent experiments. c Quantification of RsaI and RsaE Northern blot results described in b. Shown are the averages and standard deviations calculated from three independent experiments. d Expression of RsaE targets in Δrnc and ΔrsaI strain complemented with a plasmid expressing RsaI. Shown are the averages and standard deviations calculated from three independent experiments. Values are represented as relative to the WT. Values above bars display respective p value (mutant vs WT), obtained using Student’s two-tailed, unpaired t test. The bar fill denotes the tested strain; dark grey for ΔrsaI, light grey for ΔrsaI pICS3:RsaI and white for Δrnc pICS3:RsaI. Images and raw data used to generate these results are provided in the Source Data file.
