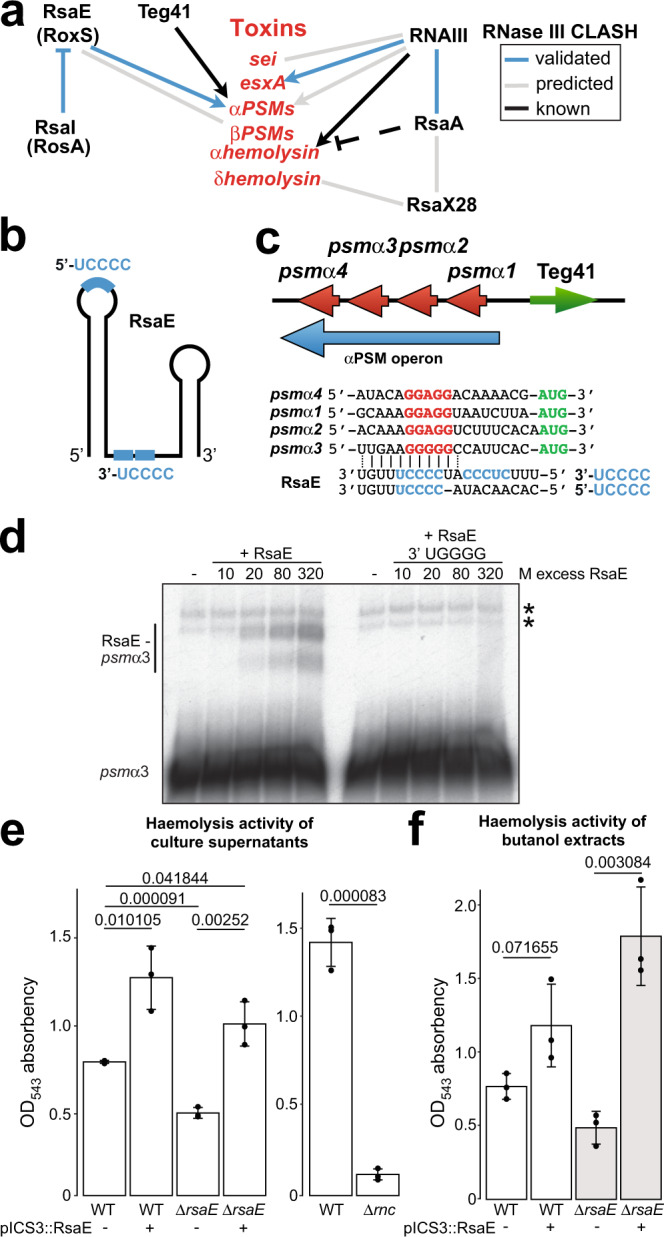
Fig. 6. CLASH predicts toxin production is extensively regulated by sRNAs.

a Predicted interactions between sRNAs and sRNAs, and sRNAs with mRNAs encoding for toxins (indicated in red). Black line indicates interactions experimentally verified by previous groups. Grey lines indicate interactions predicted by CLASH and blue lines indicate interactions predicted by CLASH that we experimentally verified. Dashed lines indicate indirect regulation. b Schematic representation of the structure of the RsaE sRNA. Blue lines and blue text indicate the RsaE UCCCC seed sequences. c Schematic representation of the αPSM operon (blue arrow), the location of the four αPSM genes in the operon (red arrow) and the location of the Teg41 sRNA in this genomic location. Below that, a multiple sequence alignment of psmα1-4 Shine-Dalgarno (red) and translational start codon (green) regions aligned to the RsaE seed sequence motifs. CLASH detected interactions between the 3ʹ UCCCC motif (light blue) of RsaE with the psmα2 and psmα3 transcripts but similar base-pairing interactions can also be drawn with all the PSM transcripts and with the 5ʹ UCCCC motif (light blue). d The 3ʹ UCCCC motif of RsaE is involved in base-pairing with psmα3. EMSA between radiolabelled RsaE and psmα3 transcript containing the binding sites predicted by CLASH. As a negative control, an RsaE fragment was used in which the 3ʹ UCCCC motif was mutated to UGGGG. Asterisks (*) indicate self-oligomerisation of the psmα3 RNA as these are produced in the absence of RsaE and do not increase in abundance when increasing amounts of RsaE is added. Results from a single experiment is shown and the raw data is provided in the Source Data file. e Haemolytic activity of supernatants from USA300 LAC WT, RsaE overexpressing strains, ΔrsaE and Δrnc (RNase III) deletion mutants. Supernatant from overnight cultures was mixed with human blood and the degree of blood cell lysis was measured through optical absorbency. Shown are the averages and standard deviations calculated from three independent experiments. Values above bars display respective p value, obtained using Student’s two-tailed, unpaired t test. f As in e but after performing butanol extraction on supernatants to enrich for PSMs. Raw images and data used to generate (d–f) are provided in the Source Data file.
