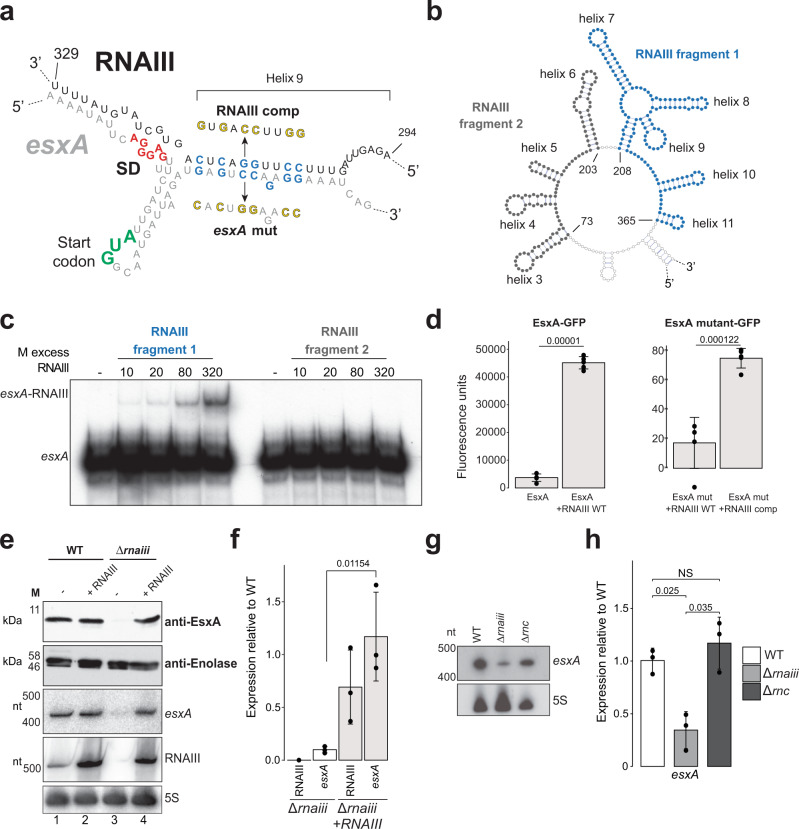
Fig. 7. RNAIII base-pairing with the esxA mRNA is required for EsxA production.
a Predicted base-pairing interactions between RNAIII and esxA as found through CLASH. Green text: translational start codon; red text: Shine-Dalgarno (SD) sequence, blue text: nucleotides that were mutated (yellow) to generate the seed and the compensatory mutants. b Secondary structure of the region containing RNAIII fragments 1 (blue) and 2 (dark grey) that were used for in vitro binding assays. c EMSA between radiolabelled esxA and RNAIII fragment 1 (blue text; containing helix 9) and RNAIII fragment 2 (grey text). Results from a single experiment is shown. d In vivo GFP-fusion reporter assay76. A portion of the 5ʹ UTR and CDS of esxA was fused to sfGFP and expressed in RN4220. FACS was used to measure GFP fluorescence of WT and esxA seed mutant upon RNAIII overexpression. “RNAIII comp”: mutant predicted to base-pair with the esxA seed mutant. Shown are the averages and standard deviations for five independent biological replicate experiments. Values above bars display p-value (mutant vs WT; student’s two-tailed, unpaired t test). e Stability of EsxA protein and mRNA upon RNAIII deletion and restoration. The Eno1 protein signal was used as a loading control. Northern blotting was performed to detect esxA, RNAIII and 5 S rRNA levels. Shown are representative results from three independent experiments. Statistical significance was measured through Student’s unpaired, two-tailed t test. f Quantification of the results in e. Shown are averages and standard deviations. Values above bars display p value (mutant vs WT; student’s two-tailed, unpaired t test). g Stability of esxA mRNA upon deletion of RNase III. Shown are northern blot results from one of three independent biological replicate RNA samples that were analysed by RT-qPCR (h). h Expression of esxA in WT, RNAIII and RNaseIII mutants. Shown are the mean and standard deviation of three independent biological replicates. Values above bars display p values (mutant vs WT) obtained using Student’s two-tailed, unpaired t test. Strains tested: WT (white), Δrnaiii (light grey) and Δrnc (dark grey). Raw images and data used to generate (c–h) are provided in the Source Data file.

