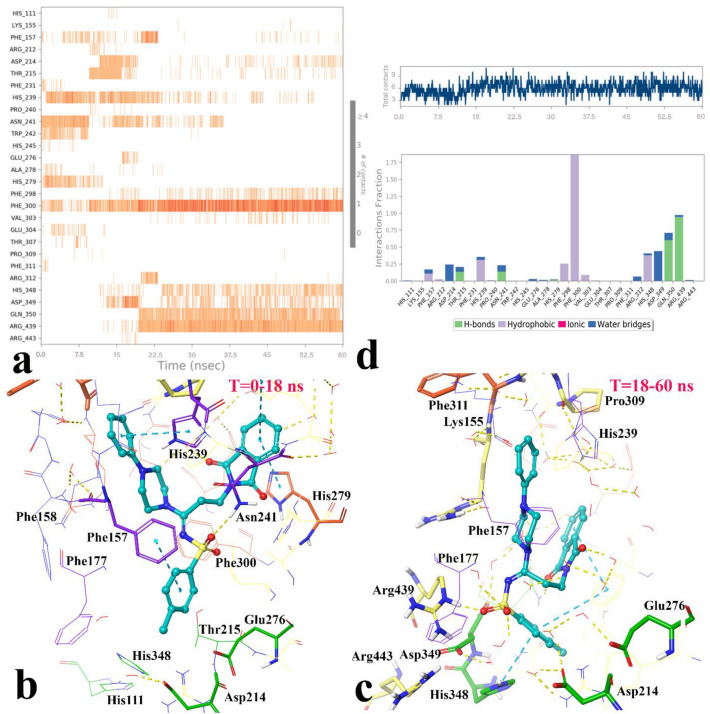
Figure 10.
The timeline representation of the interactions shows the residues interact with compound 4m in each trajectory frame (more than one specific contact with the ligand is represented by a darker shade of orange) (a). The 3D representation of α-glucosidase in bound-state with compound 4m in two different orientations related to 0–15 ns (b) and 15 to the rest of simulation time (c). The quantity of contacts and the simulation interactions diagram panel in which the stacked bar charts are normalized over the course of the trajectory: some protein residues may make multiple contacts with the ligand (d) (Desmond v5.3).

